In a recent Blog, I showed that the Dow Jones Dividend Index, which is comprised of quality, large-cap companies with high and growing dividends, has made a very sharp turn and in recent weeks has broken to a new high. I said this action signaled a flight to safety, as well as a search for predictable income. In a second blog, I detailed the fall in 30-year Treasury bond yields, which I described as signaling a top in interest rates and providing additional evidence that investors' concerns for safety have become paramount. Let me complete the trilogy by working backwards among capitalization, growth vs. value, and security types to show how powerful this shift in investment momentum has become and how long it is likely to last.
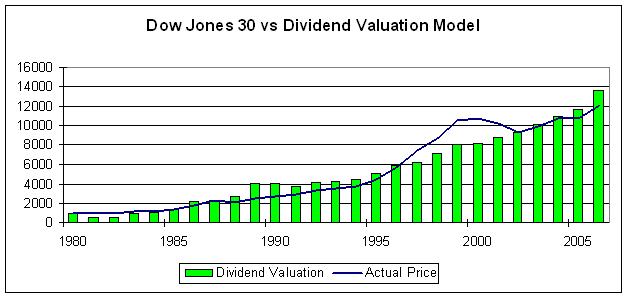
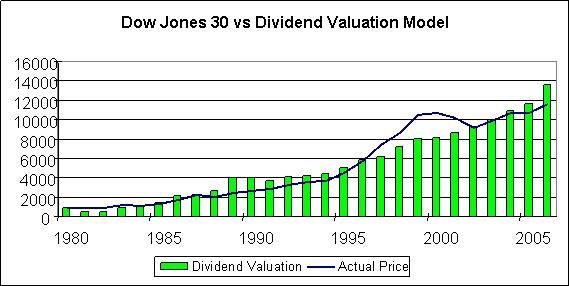
This analysis of the relative strength of various kinds of stocks is key because small and mid cap stocks have outperformed large caps for the last six years, leaving many people muttering to themselves (including me) why the great fundamentals of high quality companies were being almost ignored. I have cited on at least two occasions in these blogs that by my calculations for the fair value of the Dow Jones Industrials is closer to 13,000 than it current fixation with 11,000.
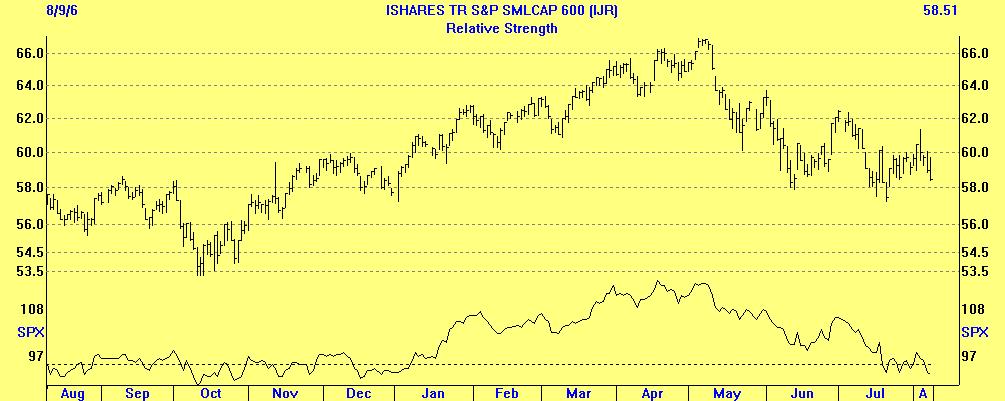
......................S&P Small Cap Index............
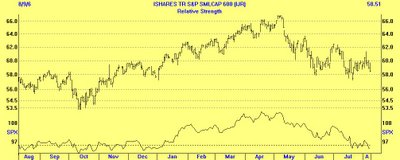
The first chart is of the S&P 600 Small Cap Index vs. the S&P 500 index. The graph on the top of the chart shows the Index itself, while the lower graph shows the Index vs. the S&P 500. The index looks very toppy, but the lower graph shows a serious breakdown compared to the S&P 500. In other the words, small cap stocks are not only falling, they are falling at an accelerating pace relative to large cap stocks. Another blow to small caps may be near. Notice that the lower graph (most recent data at lower right) appears to be breaking down from its recent consolidation attempt. Small Caps have underperformed large caps by nearly 11% over the past three months. The chart makes clear that, at least over the last 3 months, big caps have overtaken small caps, and this trend looks pretty solid to me.
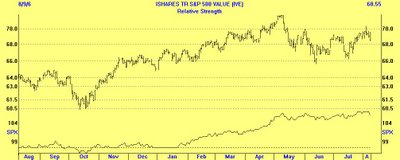
..................S&P 500 vs. S&P 500 Value................
If big cap stocks are outperforming, our next question is, is there a distinction between value and growth?
The second chart is of the large cap S&P 500 Value Index. The lower graph is comparing the Value Index with the S&P 500 itself. The S&P Value Index includes those stocks in the S&P 500 with lower price to book, price to earnings, and price to sales, and higher dividend yields. The growth sector(not shown) is the other half of the index.
Since we are dividing the S&P 500 into only two sectors, if the value sector is rising vs. the S&P 500, as it is on the bottom graph, that means that the growth sector is falling on a relative basis. The value sector's angle of ascent(shown on the lower graph) is very convincing. This means that not only is value outperforming growth, but the growth is in a freefall. This would corroborate the notion that investors are less willing to bet that high earnings growth will continue.
Thus far in our analysis, large-cap stocks are performing better in the near term than small caps, and among the large-cap stocks, the value sector is performing dramatically better than the growth sector.
The final part of the trilogy is a further "drilling down" to determine what type of large-cap, value stocks are doing the best in the near term. That answer is as you might expect: stocks with a higher than average dividend yield and consistent dividend growth, such as those contained in the Dow Jones Dividend Index.
..........DJ Dividend Index vs. S&P Value Index......
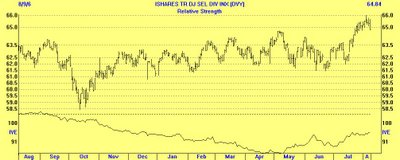
There are two key features to this chart. The top graph shows that dividend stocks have broken to a new 12 month high in recent weeks. No other major indices has done this. Second, the lower graph shows that the relative strength, which had been heading in the wrong direction until April, has made a remarable u-turn and is now headed sharply higher.
Value stocks are doing better than almost all other major sectors, but on a relative basis, the Dow Jones Dividend Index is gaining ground almost daily. I expect this trend to continue.
Large over small, value over growth, dividend over all. That's the picture I see, and the evidence is clear that this trend has a way to go. I'll describe these trends in the weeks ahead.
Dividends are our world, and dividends have come to the forefront in these uncertain times. It is too simple to say that sooner or later they always do, but that says it about as well as we know how.


 If big cap stocks are outperforming, our next question is, is there a distinction between value and growth?
The second chart is of the large cap S&P 500 Value Index. The lower graph is comparing the Value Index with the S&P 500 itself. The S&P Value Index includes those stocks in the S&P 500 with lower price to book, price to earnings, and price to sales, and higher dividend yields. The growth sector(not shown) is the other half of the index.
Since we are dividing the S&P 500 into only two sectors, if the value sector is rising vs. the S&P 500, as it is on the bottom graph, that means that the growth sector is falling on a relative basis. The value sector's angle of ascent(shown on the lower graph) is very convincing. This means that not only is value outperforming growth, but the growth is in a freefall. This would corroborate the notion that investors are less willing to bet that high earnings growth will continue.
Thus far in our analysis, large-cap stocks are performing better in the near term than small caps, and among the large-cap stocks, the value sector is performing dramatically better than the growth sector.
The final part of the trilogy is a further "drilling down" to determine what type of large-cap, value stocks are doing the best in the near term. That answer is as you might expect: stocks with a higher than average dividend yield and consistent dividend growth, such as those contained in the Dow Jones Dividend Index.
..........DJ Dividend Index vs. S&P Value Index......
If big cap stocks are outperforming, our next question is, is there a distinction between value and growth?
The second chart is of the large cap S&P 500 Value Index. The lower graph is comparing the Value Index with the S&P 500 itself. The S&P Value Index includes those stocks in the S&P 500 with lower price to book, price to earnings, and price to sales, and higher dividend yields. The growth sector(not shown) is the other half of the index.
Since we are dividing the S&P 500 into only two sectors, if the value sector is rising vs. the S&P 500, as it is on the bottom graph, that means that the growth sector is falling on a relative basis. The value sector's angle of ascent(shown on the lower graph) is very convincing. This means that not only is value outperforming growth, but the growth is in a freefall. This would corroborate the notion that investors are less willing to bet that high earnings growth will continue.
Thus far in our analysis, large-cap stocks are performing better in the near term than small caps, and among the large-cap stocks, the value sector is performing dramatically better than the growth sector.
The final part of the trilogy is a further "drilling down" to determine what type of large-cap, value stocks are doing the best in the near term. That answer is as you might expect: stocks with a higher than average dividend yield and consistent dividend growth, such as those contained in the Dow Jones Dividend Index.
..........DJ Dividend Index vs. S&P Value Index......


