Showing posts with label Stocks. Show all posts

Wednesday, October 23, 2024

Using Simple Mathematical Calculations to Value Coke vs. PepsiCo

 1. In my recently released book, The Hidden Power of Rising Dividends, I described my 40-year journey into finding methods of valuing stocks.

2. My journey of valuation discovery was always about finding methods that worked, not just focusing on dividend investing, although for many companies, dividends are the best indicator.

3. Over the next few months, I am going to do a series of valuation comparisons of great companies of our country and the world. These comparisons will describe the various methods I have found to be helpful. The first two are Coke and Pepsi.

4. Coke and Pepsi are powerful brands that have won over our taste buds, grocery shelves, and portfolios. Most people are in one camp or the other, but these two companies are very similar in many ways. My blindfolded taste test can't tell them apart.

5. Since they are so dominant and so similar in their products and marketing, I have found that most people assume they are almost always efficiently priced and valued at about the same level. In this first look at the tools I have learned to use, a surprise may be in store for you.


 In valuing Coke and Pepsi, I am using a multi-stage correlation model. This model computes a correlation score, called R2, for eight different fundamental indicators for each company, such as earnings, dividends, sales, profit margin, GDP, etc., compared to changes in the company's annual stock prices. With both companies, the correlation, R2, between their annual dividends and stock prices is above 90%, and overrides the need to include any of the other fundamentals. Very simply, this means that over the last 15 years, the annual changes in the dividends for each company were able to explain 90% of the annual changes in its price. 

Next, look at each chart and note that stock prices are on the vertical axis and dividends per share are on the horizontal axis. The red line is the actual annual price over the last 15 years and the green line is the predicted price using the correlation formula. Here is where the model begins to talk. While these two companies are very similar in what they do, they are not similar in prospective valuation. PepsiCo's chart shows its current selling price of over $175.00 is well under its predicted price of $190.44. Coke's story is just the reverse. It is currently selling for over $68 per share, but its predicted price says it should sell for $63.74.

Remember, this analysis is pure math. It is not a deep analysis of each company's intrinsic value. This is just a statistically significant computation comparing the changes in each company's annual dividends with changes in their annual stock prices. Yet, with 90+% correlations for both companies, to ignore what the dividends are saying would be unwise. Indeed, these computations are saying Coke is over 15% more expensive than PepsiCo. A spread that wide would seem to favor PepsiCo at present. Next, however, we all know that the market always looks ahead. Next time I will share with you howe we can adjust the current valuations for a look into the future. In the meantime, let's just see how the the two stocks perform over the next few months.   

Tuesday, October 21, 2014

Is The Economy Slowing Down? Not According to Dividends...

In our most recent blog, we indicated that corporate America’s dividend actions during this time of uncertain global growth will be among the best indicators of the true U.S. and global economic outlook.

Most investors don’t pay too much attention to a company’s dividend policy.  To Wall Street, dividends are just a product of earnings. They don’t mind the dividend payments they get each quarter, but they aren’t really focused on dividends.  Wall Street spends more time chasing earnings predictions and short-term price appreciation.

Despite the recent increase in popularity of dividend investing for income, most people still miss the most important point of all: the dividend is directly linked to the true health of the underlying business and the management’s expectations for the next 12 months and beyond.

Why is this?  For two main reasons:

  1. If you are the CEO of a company and you see a slowdown in future sales and earnings growth, you’re probably not too excited about more cash leaving the company.  Rather than increasing your cash dividend by 10% again this year, you might opt to hold some cash back in reserves and raise the dividend by, say, 5% instead.

  2. Dividends can’t be faked.  Not even the most creative accountant in the world can generate real cash.  Earnings numbers can be misleading, especially at significant turns in the market. Dividends, on the other hand, cannot be faked.  If a company falls into real trouble, it won’t be long before they have to conserve cash and cut their dividend (or at least stop growing it).

We believe that by focusing on dividend history and dividend growth, we can learn a great deal more about a company’s true future prospects.  We’ve seen it time and time again - the companies that slow or cut their dividends have dramatically underperformed the rest of the stock market over the next 12-24 months.

In addition to our numerous valuation models, we have a new model that we’ve built that uses data that is unavailable to the vast majority of investors.  In fact, we might be one of the only investment firms in the U.S. that (a) has this data available and (b) pays any attention to it.

In our view, this tool will be a powerful predictor of when a company starts to take a turn for the worse (or become optimistic about their future).  With this tool, we will be one of the first to be flagged about a company’s dividend behavior and be able to quickly make a decision based upon what we see - well in advance of the rest of the market.

We now have the ability to track not only the dividend announcements on a day-by-day basis, but what Wall Street and Bloomberg were estimating that the most recent dividend action would be.  Based upon statistical backtesting, these dividend estimates have an 88% accuracy rating.  Below is a summary of what the dividend tracker is currently telling us:


Using this tool, we will be able to see:

  1. What the companies believe economic growth will look like.  Are companies starting to slow their dividends as a whole?  Or accelerate them?  The median dividend increase for companies who have announced a dividend increase over the past 3 months is 12.5%.  That is even higher than the year-to-date number of 11%.  Based upon this number, companies are actually accelerating their dividends at a faster pace than they were earlier in the year.

    Perhaps the most encouraging news of all is that over the past 2 weeks, when the stock market was concerned about global growth, dividend announcements were actually a positive surprise of 2.1%.

  2. Are companies expecting to perform better or worse than expected?  By comparing actual dividend announcements vs. dividend growth expectations, we will be able to see red flags on the day they arise.  Of the companies who made announcements, 35 beat expectations while 9 missed.  If any of our companies were among the misses, we would probably give them a call to see what was going on.

  3. Have there been any companies that were supposed to raise their dividend that did not?  In our mind, this is the worst sin a company can commit.  Unless there is a good reason for it (like better investment in projects or a special dividend upcoming), a dividend cut is a bad sign for the future.  Over the last 3 months, there were 67 companies expected to raise their dividends. Every single one of them raised the dividend.  No cuts.  No flat lines.  On average, those companies beat expectations by 1.7% overall. That’s a very good sign.

So far, there is absolutely no evidence that U.S. or multinational companies are pulling back on their dividend increases.  That is very good news in the face of bad headlines across the world.  Companies are still very confident in their futures.  Despite the near “correction” (10% down) from top to bottom, dividends and dividend growth is still intact.  Until that changes, we believe the outlook for the companies in our portfolios is still very good.

Wednesday, September 24, 2014

Barnyard Forecast: More Bull to Come or Is the Bear Growling?

Our last published Barnyard analysis appeared approximately 1 year ago in September of 2013.  At that time, the Barnyard Forecast resulted in 6 out of 8 points, indicating that the market would be favorable over the next 6-18 months.  That has come true, with the S&P 500 up nearly 20% since then.  We expect many will be surprised by the latest Barnyard Forecast.

During this week’s Investment Policy Committee meeting, we updated our “Barnyard Forecast” model.  The Barnyard Forecast is a basic model we use to determine whether the current environment is accommodative, neutral or restrictive towards stock market growth. Since 1990, the Barnyard model has correctly predicted the general direction of the market over the next 6 to 18 months with approximately 80% accuracy.

The Forecast gets its name from the acronym of its components: economy, inflation, earnings, and interest rates = opportunity for stock market appreciation (E+I+E+I=O).  Each factor is rated as positive (2 points), neutral (1 point), or negative (0 points) for stocks based upon historical relationships between that component's economic data and its likely effect on the Federal Reserve's monetary policy and market reactions.  The total points are then added up to arrive at a score between 0 and 8.  A score above 4 indicates a positive environment for stocks.  

Economy - 2 Points

When the economy is growing slowly, the Federal Reserve's projected actions over the next 12 months should favor stocks.  The Forecast score is positive when economic growth is less than the optimal, non-inflationary rate of economic growth of 3%.
Economic growth has improved significantly since the 1Q 2014 numbers.  However, year-over-year GDP growth remains below the 3.0% mark.  At this moment, we’re at about 2.5% with the 3-5 year range between 1.5% and 3.0%.  Economic growth would need to be at least 3.0% before the Federal Reserve would start taking any action to raise rates.  In our view, even 3.0% might be too low in light of the other data coming from the economy.  The bottom line: the economy is still not growing fast enough to warrant monetary policy tightening.  Positive for stocks – 2 points. 

Interest Rates - 2 points

Historically, the yield curve spread (difference between long-term and short-term interest rates) has been a predictor of economic performance.  As long as the spread remains positive, stock markets tend to rise.  When it turns negative, that is a danger signal for stocks.  
Spreads between long-term and short-term rates are currently very positive.  The 2-year U.S. Treasury is yielding around 0.5% versus nearly approximately 2.5% on the U.S. Treasury, a positive spread of 2.0%.  Since we are nowhere near a negative yield curve, this component of the model strongly suggests a favorable environment for stocks.  2 points.

Earnings - 2 points

Earnings growth is a statistically significant driver of stock market prices.  Over the long-term, earnings growth for U.S. corporations has been 7%.  The Forecast scores growth greater than 7% as being positive for stocks.  

In September 2013, the 2nd quarter earnings were only 3% - well under the 7% level.  This time around, earnings growth is markedly improved.  Last quarter’s earnings growth was close to 9%.  Earnings growth projections are for even better grow over the next 12 months.  Companies have continued to grow despite the lackluster economy.  Positive for stocks - 2 points.

Inflation - 2 points

The Federal Reserve's optimal level for core inflation is approximately 2% to 2.5% year-over-year.  Core inflation under 2% allows the Fed to stimulate the economy without creating inflationary problems and is positive for stocks.  Inflation greater than 2% is negative for stocks.

Mr. and Mrs. America tend to watch the Consumer Price Index (CPI) and core CPI (excludes energy and food).  However, the Federal Reserve pays more attention to the Personal Consumption Deflator, which tends to run about 0.5% less than CPI.  At the moment, CPI is about 2.0% and the Personal Consumption Deflator is around 1.5%.  Unless inflation ticks up at least another 0.5%, we don’t anticipate the Fed is going to raise rates.  Positive for stocks - 2 points.

= Opportunity for Stocks - 8 out of 8 (Positive)

Adding each of the 4 factors totals a perfect score of 8, which indicates conditions are very favorable for stocks.  Our Barnyard Forecast has historically done a good job of indicating the general trend of the market.  While there are many unknowns surrounding the Federal Reserve's next moves, our Investment Policy Committee agrees with the Forecast's projection of continued positive returns for the market over the next 6 to 18 months.

Thursday, May 22, 2014

Economic Indicators Point to Slow, Steady Growth in Economy & Stocks

We have several economic metrics that we follow very closely at DCM.  These indicators give us a peek into the health of the economy and indicate where we may be headed.  We want to share three of those indicators with you and provide an overall outlook on current U.S. economic conditions and what they might mean for the stock market for the remainder of 2014.

1. After-tax Profits


The price of the S&P 500 index (blue line/right axis) plotted against after tax profits for the entire U.S. market (red line/left axis), which is measured in trillions of dollars.

Of all the indicators we watch, this one might be the most compelling argument for the strength of U.S. corporations.  After-tax profits reached a high around $1.4 trillion in late 2006 before their sharp decline during the Great Recession of 2008-09.  Today’s levels are well above where they were pre-2008 and show no signs of slowing down.  Companies are operating with incredible efficiency.  Many of the companies we follow can produce as much or more than they did prior to the Great Recession with significantly fewer employees. While this hasn’t been good news for employment (more on that in a minute), it is very positive for corporate earnings.

Tuesday, February 11, 2014

ABCs of Dividend Investing: How to Navigate the Current Sell-off

Since the beginning of the year, stocks have fallen by about 5%.  The modest pullback has many investors wondering whether a full out “correction” (drop in prices by 10% or more) is on its way.  

When the inevitable fluctuations in stock prices come, investors are all left with the same question: What should I do with my portfolio?

At Donaldson Capital Management, we have a particular strategy for handling market upswings and downswings.

What Is An ABC Portfolio?

As many of you are familiar, we invest only in dividend-paying stocks but we break down our portfolios into three types of dividend-paying stocks.  For those of you who are not familiar, we structure our portfolio into A, B and C stocks.  

Below is a summary of each sub-portfolio and it’s specific characteristics.  You can read about each sub-portfolio in more detail here.


Our primary investment model (“Rising Dividend-Cornerstone”) is comprised of all three types of dividend stocks.  

Regardless of what type of market we are in, a portfolio of A, B and C dividend stocks will have at least one group that performs better-than-expected.  This type of portfolio significantly outperforms

Wednesday, January 08, 2014

Dow Jones 18,000: Here's How We Get There

2013 was a banner year for the stock market.  On December 31st, the Dow Jones closed at an all-time high for the 56th time of the year, ending with a total return of over 27%.  

While stocks had their best year since 1997, the economic news did not seem to support such a dramatic increase in stock prices. 


  • At the beginning of 2013, Wall Street estimated 8% earnings and dividend growth for the year. Dividends met expectations, but earnings growth was a disappointing 4.5%.
  • Sub 2% GDP growth continued for most of the year, and while the unemployment rate fell, much of the improvement was a result of frustrated workers giving up their job searches and thus no longer being counted in the official unemployment rate. 
  • Sequestration hit in 2013, reducing Government spending and dragging down already slow U.S. GDP growth by about 0.5% for the year.
  • Interest rates, which are typically inversely correlated with stock prices, increased significantly.  The yield on 10-year U.S. Treasury bonds began the year trading below 1.85%. After the Fed began talking about tapering Quantitative Easing (QE), the 10-year started its upward climb to end 2013 just above 3.0%.
  • The Government shutdown in mid-October threatened to derail economic recovery and highlighted growing dysfunction in Washington. 

Why Was the Market Up 25%+?

With so much lukewarm economic data, how could the markets have gone up over 25% in 2013?

Friday, May 03, 2013

Citizens of Bondsville: Welcome to Dividendsville

Many in the financial media are wringing their hands that the current bull market in stocks isn’t acting right.  "It’s too defensive," they say.  Put another way, they believe the wrong kinds of stocks are leading this bull; therefore, it is not to be trusted.  Nothing could be further from the truth.  One day these growling bears will admit they are wrong and come charging into this bull market.  That will be the sign for us believers to know it’s time to leave.  But, our guess is that time is a long way off.

The right stocks for a normal bull market are the so-called cyclical stocks – Basic Materials, Financials, Consumer Cyclicals, Industrials and Techs.  These kinds of companies sell products that last for three years and longer.  An uptick in these sectors of the stock market would mean that new incremental buying is occurring in these “long-term” sectors and would mean that big employment gains should be very near.

The leaders of the current uptrend in stocks are the defensive stocks – Consumer Staples, Healthcare and Utilities.  Companies in these sectors sell products we buy and use every day -- think of Procter and Gamble as the epitome of a defensive stock and Caterpillar as its counterpart.  One can’t put off the purchase of Crest toothpaste nearly as long as they can put off buying a new D9 earth mover.

Today’s bull market is not a classic bull market from the perspective of what kinds of companies are leading the pack, but it is a bull market nevertheless.  The easiest way to think of it is as an asset-allocation shift bull market.  As the Fed has continued to keep interest rates near zero, more and more investors have decided to flee their poor treatment in Bondsville to head for better returns in the suburbs.  They have traveled through the nearby communities of Junk Bondsville, Preferred Stockville, and - in recent months - have been moving into Dividendsville.

They have said, “I would rather take the risk of owning the common stock of Procter and Gamble or McDonalds than accept a 1.6% taxable return from a 10-year U.S. Treasury Bond.”

Certain types of large, multinational stocks are now being seen as having less risk than U.S. Treasury bonds.  The math is simple:  On an after-tax, inflation-adjusted basis the 10-year Treasury is a sure loser over its lifetime.  That’s not even considering the sad shape U.S. Government finances are in today.  On the other hand, Procter and Gamble (PG) and McDonalds (MCD) are companies that have taken on all comers and are not only still standing, but prospering.  Both have dividend yields near 3%.  

PG has paid a dividend since 1891 and raised it for 59 consecutive years.  PG’s dividend has risen at an annual rate of over 8% during the last three years and over 9% in the last five years.  At an 8% growth in its annual dividend, PG’s dividend will double in nine years.  Even if PG’s stock price does not move a penny over the next nine years, its dividend yield will rise to 6% - based on today’s price.  Its internal rate of return would be about 4.5% from dividends alone.

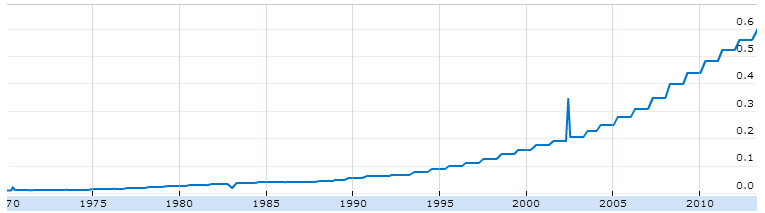
Proctor & Gamble (PG) Dividend since 1970
MCD’s dividend growth of near 12% per annum over the last three years and 3-5 year projected growth rate are both higher than PG’s.  

Procter and Gamble and McDonalds are not the only members of Dividendsville.  There are nearly 100 (and growing) companies worldwide that are becoming viewed as being safer than governments.

You won’t find these kinds of companies standing in line for government hand outs.  Indeed, it is the taxes these companies pay year after year that the U.S. government is so anxious to give away.

These companies cannot create income through taxation, but they can do something even better – compete.  They balance their books every year.  They navigate the byzantine regulations in every country in which they do business.  They hire and train employees for jobs that have a future.  They innovate.  They take risks.  They give back to every country and community in which they do business.  And - most importantly - they build flexibility into their decision-making that allows them to be profitable nearly every single year. 

Compared to bond yields, the current dividend yields of PG, MCD, and a host of other similar companies are actually higher than they should be.  If the current slow growth economy continues through the end of this year, we believe dividend yields for these kinds of companies will fall to nearly 2.5%.  For dividend yields to fall despite rising dividends for these companies, it would mean their stock prices would have to rise 15% or more between now and then. 

This might seem like an overly aggressive view of the performance potential for these stocks, but there is a line forming in the heart of Bondsville that stretches as far as the eye can see.  They are leaving town.  Whether or not they know it now, they will find their way to Dividendsville.  When they do, they will never leave.   


Our clients and staff own MCD and PG.

This discussion is provided for information purposes only.  Please consult your investment advisor concerning any ideas expressed here.  

Friday, February 10, 2012

To Dividend or Not to Dividend, That Is the Question?

To dividend or not to dividend, that is the question?  In 2011, most of what we have been saying about dividend stocks for the last 15 years came into full view for everyone to see.  In a weak stock market, the cash payments distributed by dividend-paying companies were more highly valued than betting on the come with the non-dividend payers.  During most of the year, the dividend yields of many stocks were higher than the yield on a 10-year U.S.Treasury bond.  This fact alone lifted many consumer staple, energy, health-care, and utility stocks.  Taken as a group, dividend-paying stocks significantly outperformed non-dividend paying stocks.

In 2011, dividend-paying companies, particularly those that have a history of consistently raising dividends, gradually were seen to be bond substitutes.  This is due to the compounding effect of rising dividends.  A company with a 3% dividend yield today will be yielding 6% in ten years if its dividend grows at a 7% annual rate.   A company yielding 2% today with its dividend growing 12% per year will yield near 7% in 10 years.

During the year, dividend paying stocks became the equity asset of choice.  There was almost a perfect symmetry between dividend yield and total return:  The higher the stock's dividend yield, the higher was its total return for the year.  For example many utilities enjoyed total rates of return of 15% or more in a year when the S&P 500 grew by about 2%.

But here in 2012, the robust early gains for the S&P 500 (5%) and the Global Dow (10%) have presented investors with a very difficult question:  Do we continue to focus on the "knowns"of dividend investing, or do we abandon them for the  "unknowns"  of gut feelings and hot tips?

The reason this question is so important is because the impressive stock market gains in the new year have caused many strategists to raise their estimates of 2012 stock market performance to 15% or more.  A 3% dividend yield looks good in a 2% stock or bond world, but it does not stack up so well against 15% returns.  Because of this many articles have been written arguing its time to move away from dividend investing and start pursuing growth again.

We would argue that dividend paying stocks are likely to perform just as well as non-dividend payers, even if stocks rise by 15%.  The reason is simple, our valuation models now predict that the average stock in our portfolios, which has a 3.5% dividend yield, is undervalued by almost 25%. You must remember, we focus on rising dividends.  To achieve a steady stream of rising dividends, a company must also have a solid stream of growing earnings.

In short "To Dividend or Not to Dividend" may be a false question.  Dividend-paying stocks can offer market-type returns when stocks grow by up to 15%.  In our experience, dividend-payers only begin to lag the overall market when the S&P 500 grows by 25% or more.  Even then, they will get most of the gains.

Considering how well the dividend payers do in down markets, and in view of all of the uncertainties in the world, we still believe "To Dividend" is the right answer for most people.    

We own dividend-paying stocks.

Tuesday, November 29, 2011

United Technologies: The Hidden Dividend Star

United Technology (UTX) is the Dividend Star most of the simple dividend-growth filters miss.  This is because they do not raise their dividend every year. UTX takes action on its dividend every six quarters, not every four quarters, as do many dividend stars.

I have even tried to explain to the company's investor relations department that while their every-six-quarters dividend hikes has been quite predictable, that such a policy means that about every three years their annual dividends flat line. Thus, the company is not included on many lists of companies with long-term histories of consecutive dividend hikes.  No matter says the company. They like to do it the their way.

In this case who am I to push against such a winning record, just to make it simple.  UTX has one of the most consistent dividend growth records of any company I follow.  The following are their 20, 5, and one year annual dividend growth rates.
  1. 20-year growth rate  11.3%
  2. 5-year growth rate    12.5%    
  3. 1-year growth rate    12.9%
To top it off, the estimate of UTX's three to five year dividend growth rate is just under 12%.  At that rate of growth its dividend will triple over the next ten years.  Not bad for a company that has a current yield of 2.6%.

Despite UTX's consistent dividend hikes and earnings growth over the last twenty years, the Dividend Valuation chart at the top of this page suggests that the company is significantly undervalued based on the historical relationships among its price growth, dividend growth, and interest rates.  UTX's current price (red line) is much lower than its current valuation (blue bar) and even lower yet, than our estimate for next year (checkered blue bar).

The so-called Correlation Index, which measures how tightly the average stock is tracking the major indices, has risen to as high as 85% in recent weeks.  Its normal reading is near 15%.  This means that the constant on again off again European bail out proposals have turned what is normally a market of stocks into a stock market.  What I mean by this is that almost all stocks have been caught in the maelstrom of big up and down days, which would indicate that all companies have about the same future profit and dividend potentials.  If you take a few minutes to think about this, the truth almost smacks you in the face.  The one thing we know for sure is that the future prospects are not the same for all stocks, thus, it is just a matter of time before stocks start to trade on the bases of their own unique fundamentals, not the generalized fears of the European situation, no matter how things turn out.

In this regard, we believe UTX has quite a pedigree and will ultimately break away from the pack and show it star quality..   


I own UTX.

Friday, October 21, 2011

12 Random Ramblings

Every working day of our lives we get questions.  Questions about the stock and bond markets.  Questions about how natural disasters, politics, or economic and business crises will play out in the market place.

In this weekly blog we try to keep our comments narrowly focused on our dividend investment strategy.  As we were composing our most recent quarterly letter we admitted to our readers that at times we sound like a one trick pony:  our solution for every challenge and every opportunity is always -- buy and hold quality rising dividend stocks.  In the long run we know that will work.

Yet the matters we discuss and decide at our weekly investment policy meetings cover the waterfront of issues.  In this regard, heaven help us, we are like politicians because we have to have a basic understanding and a few talking points on just about everything that is going on in the world.  

We thought our readers would appreciate our short takes on a long list of issues facing our nation and the world.  Normally, when we write these blogs or our client letters, we try to offer solid proofs for our positions.  In this piece, we are not going to do that.  We are just going to give our views, without supporting arguments.  This way we can cover a wide range of issues that you may have questions about.  It is our plan to periodically offer an update to what we are calling 12 Random Ramblings from the Investment Policy Committee.
  1. Stocks are undervalued by about 25%.  Energy, Industrial, and Consumer Cyclical stocks are very cheap.
  2. US Government bond yields are at historic lows, but will not rise much over the next year.
  3. Inflation will fall.
  4. US Corporate profits will continue to surprise to the upside, driven by business in developing nations.
  5. Greece is already bankrupt, but the European Union will keep the country on life support for an extended time.
  6. The market has already priced in a Greek default.
  7. The US economy will not fall into recession and may surprise to the upside in the fourth quarter of this year.
  8. The worldwide economy will grow by at least 3%, after inflation, this year.
  9. Dr. Doom, Nouriel Roubini, has signaled better times may be on the horizon for the US and the world by putting his investment advisory firm up for sale. 
  10. The average dividend payout ratio for the S&P 500, which is now, under 40%, will move back toward its 80-year average of 50% over the next five years.
  11. There is still a chance that Hillary Clinton will run against President Obama if his polling numbers don't improve by December.  She would likely beat any Republican, and the stock markets would rally, not because her views are so much different than Obama's, but because the economy and the markets did so well under Bill Clinton.
  12. If  Roubini is selling his company, the price of gold may have already seen its highs.

Greg Donaldson, Chairman of the Investment Policy Committee
Donaldson Capital Management, LLC

Thursday, July 21, 2011

Dividends Are Rocking and Rolling

Dividends have rocked and rolled over the past five and half years.  The question is where will they be dancing from here?

The chart at the right shows dividends paid by S&P 500 companies on a rolling 12 month basis since December of 2005.

For the first three years of this period, dividends rolled higher, peaking near $31.  Beginning in August of 2008, dividends fell like a rock, a move that more than wiped out the gains since 2005.  Since the early part of 2010, dividends have once again reversed course and are now rolling back toward their old highs.  Can this roll continue, or are there more rocks in our future?

Over the last 12 months, S&P 500 companies have paid roughly $25, still far below the nearly $31 all-time high they recorded at the peak in 2008.  However, the red dashes at the far right of the chart show Bloomberg's quantitative estimate of total dividends paid by year-end 2011.  Bloomberg believes that the current roll will continue.  They estimate total dividends for 2011 will reach $29, not far from the all-time high.  Bloomberg also estimates that the old high will be reached by the end of 2012.

If 2011 total S&P 500 dividends paid do reach the $29 estimate, it would mean that dividends would have grown for the year by nearly 21%.  Many analysts estimated that S&P 500 earnings would likely grow at that rate,  however, almost no analyst we follow made such a bold estimate for dividends.  After all, corporations have been fiercely focusing on free cash flows, and dividend payouts diminish cash.

We believe this dividend revival makes complete sense.  Corporations have produced tremendous free cash flows in recent years.  This build up in cash has three main potential uses: 1. share buy backs, 2. acquisitions, and 3. dividend hikes.  The companies we follow have done a little of all three, but they have hiked dividends at a higher rate of growth than we would have expected.  We believe the reason for this has been the growing recognition by many firms that dividend-paying stocks are enjoying renewed interest among many investors, particularly those near or in retirement. In hiking dividends they are just doing what their shareholders want.  I realize this is a very novel idea -- that a company would do what its shareholders want -- but we believe that is exactly what is happening.  There are some firms that have hiked their dividends two and three times in the last twelve months.  Activity of that kind is not an accident.  They know what they are doing and they have the cash flows to afford it.  We believe this dividend roll will continue.

If dividend hikes have been on a roll and stock prices follow dividends, a theory to which we subscribe, then current stock prices may roll a lot higher.  We would not be surprised to see them back to their old highs seen in 2008.  This won't happen in the next six months, but we can see it occurring by the end of 2012.

There are certainly all kinds of worries to contend with, but having a positive outlook is sometimes the best strategy when everyone seems to be throwing rocks at the market's prospects.

Monday, May 02, 2011

Sell in May And Go Away . . . . At Your Own Risk

Because stocks have had solid double-digit gains over the last 12 months, we hear many people predicting that they are ready for a fall.  In addition, the "Sell in May and Go Away" crowd is giving us all the statistics of how stocks have fared between May and November historically.

The reasons given for a stock sell off are full of language about momentum, price gains, and too much-too soon. We want to add very quickly that few of the "stocks are too high" crowd today were among the "stocks are too low" crowd  at the market bottom in March of 2009.  Indeed, if you go back to their blogs and read what they were saying around the bottom of the market, you will find many of them were saying "stocks are too high," even then.

In the blizzard of words we see written about the stock market, we seldom see the word valuation.  Valuation, it would seem, has no meaning in a high-octane traders' market, where computers are trading with computers for about 70% of the daily volume.  Individual investors seem to have decided that long-term value investing has gone the way of the Oldsmobile.

Ah, but we beg to differ!   In the long-run, valuation will rule just like it always has.The reason is over the last 80 years, S&P stock prices are highly correlated to both After Tax Profits and Dividends.  The computers and traders will wage their daily battles of betting on zig or zag, but in the long-run, zigs and zags will ultimately be seen as vanity, a chasing after the wind.

From a valuation perspective, stocks are still cheap and could only become expensive if the economy were to fall off a cliff and drag earnings and dividends with it.  The chart below shows index of the S&P 500 (red line) compared to Total U.S. After Tax Profits Index (blue line).  Please note that After Tax Profits reached an all time high in December of 2010 and, based on S&P estimates, will rise by nearly 13% in the second quarter of 2011 versus the same quarter a year ago. Tracking the After Tax Profits Index is our favorite way of measuring earnings, because it measures only earnings that companies actually paid taxes on.  

The graph below vividly shows that while After Tax Profits have reached an all time high, the S&P 500 has not. In fact, the chart suggests that the S&P has a long way to go to reach fair value.


Corroborating the view that stocks are still undervalued is the graph of the S&P 500 Index (red line) compared to Total Corporate Dividends Index (blue line).  Total Corporate Dividends paid is an important indicator of the health of the current turn-around in the stock market, because dividends are paid in cash and not promises.  As the chart shows, dividends took a hit during the sub prime crisis.  Importantly the chart also shows that they have turned higher.  S&P is predicting that dividends will grow nearly 10% on a year over year basis for the first quarter of 2011.  Dividends have not reached a new high, but we believe the old record will be eclipsed over the next 12 months.  This would be good news for continued stock price gains.


These two simple, yet important measures of stock market valuations are still flashing green.  That does not mean that stocks will go straight up from here.  In our judgment, it does mean, however, that saying stocks are too high is nonsense, and "Sell in May and Go Away" is worse.

Saturday, November 13, 2010

Since the Subprime Crisis Began, Higher Dividend Growth Has Been Rewarded -- Up to A Point

We recently completed an analysis to determine how companies with rising dividends have fared during the last three years, a time when overall dividend payments by S&P 500 companies were falling. 

We divided all dividend-paying companies in the S&P 500 Index into quintiles ranked according to their average annual dividend growth over the past three years. A sixth group consisted of those companies that do not pay dividends.    We then computed the average total rate of return for each quintile over the three years. 

The results are impressive and a bit surprising.  The seventy companies with the highest average annual  dividend growth rates over the past three years have outperformed 58% of all stocks in the S&P 500.  By contrast, the companies with the lowest average annual dividend growth  rate (actually a loss) only outperformed 28% of the stocks in the S&P 500.  Here's the ranking for all dividend-paying quintiles and non-dividend payers:

  1. Quintile with the highest average 3-year dividend growth outperformed 58% of all S&P 500 stocks.
  2. Second highest quintile outperformed 61% of all stocks. 
  3. Third highest quintile outperformed 53% of all stocks.
  4. Fourth highest quintile outperformed 51% of all stocks.
  5. Fifth highest quintile outperformed 28% of all stocks.
  6. Non dividend paying stocks outperformed 48% of all stocks.
To better understand these data, it is helpful to show the 3-year average annual dividend growth rate for each quintile.
  1. Quintile 1:  3-year average annual dividend growth rate of 21.8%
  2. Quintile 2:  11.3%
  3. Quintile 3:  6.1%
  4. Quintile 4:  0.0%
  5. Quintile 5: -28.0% 
The bottom line is if a company began the period paying a dividend and did not cut it, it would have outperformed at least 51% of all stocks.  A company improved its performance relative to all stocks the more it increased its dividend, except for those companies in quintile 1. 

The surprise in the data is that quintile 2 stocks, with an average 3-year year dividend growth of 11.3%, outperformed quintile 1 stocks, which had a 3-year average annual growth rate of 21.8%.

We have two comments about this surprising asymmetrical result: 1) the very high dividend growth observed in quintile 1 stocks was influenced by many large one-time dividend increases among consumer cyclicals and industrial stocks; 2)  In spite of this, we see a similar asymetrical result when comparing earnings growth versus price growth.  The stocks in the quintile with the highest earnings growth did not outperform those in the second quintile. 

Thus, in looking at both dividends and earnings we see that high growth has not been rewarded with proportionately higher price growth. This is the primary reason that we now believe the sweet spot of the stock market is in the high dividend and earnings growth companies.

We will review a few of these companies in the weeks ahead.

Bloomberg data was used for this analysis.    

Friday, October 22, 2010

Channeling Ben Bernanke

Somewhere in Washington DC Ben Bernanke is surely smiling, if only slightly.  In recent weeks, stocks have been rising and last week the Utility Index (XLU) broke to a new 12-month high, signaling that investors may be willing to take on more risk.

Amid all the worries Ben carries on his shoulders about the viability of the US economy, he has to constantly be aware of the shifting moods of the players, consumers, and business people, in the current unfolding economic drama.  Ben knows what he needs most right now is a catalyst to lift the "animal spirits" of the players so they will return to more normal consumption and investing patterns.

Click to Enlarge
There has been precious little "feel good" news in the economic data for most of 2010.  Home prices are still wallowing at low levels; unemployment is still sky high; and until recently, stock prices have flat-lined.

There has, however, been lots of good news in the earnings reports of major corporations.  But with all of the ill winds in the economic news, many investors have concluded that these earnings increases are the result of expense reductions and layoffs and will only make the US economy worse.

Ben is smiling because he knows the earnings are real, and that rising earnings will ultimately lead to job growth.  He also knows that rising stock prices in the face of poor economic news are a good sign because it means that investors are beginning to look through the current malaise to better times.

The utility index breaking to a new 12-month high is important because, as we have said before, utilities are generally considered to be bond substitutes.  Their dividend yields are more than double that of the average stock; they usually operate with some kind of monopoly power, and their financial ratings are higher than the average stock.

History shows us that almost all major turn-arounds in stocks have been led by the utilities.  As investors become more confident and begin to move out of bonds, their first landing place is usually in the stock sector they consider to be the safest.  For most people that is the utilities.  Thus, it is not surprising that in the recent uptick in stocks, utilities have broken above their 12-month highs, while the S&P 500 Index is still nearly 3% under its 12-month high.  We would expect that the S&P 500 will follow the utilities lead and break to a new intermediate high by the end of the year.

This move will be driven by the recognition that stocks are cheap compared to bonds and that Ben will see to it that bond yields won't be rising anytime soon.

Saturday, October 16, 2010

Railroads May Soon Lose Some Steam


During the last two years, the rail stocks have acted more like rockets of the 21st century than lumbering piles of steel left over from the 19th century.

Since 2009 when Warren Buffett announced he was buying Burlington Northern, investors have been steaming back into the rail stocks, hoping another big hitter would follow Mr. Buffett's lead and take out another of the big rail companies.

The rail stocks today are certainly not your grandfather's bloated, broken-down companies.  Today railroads are key players in the inter-modal freight handling business.  Importantly, they are widely seen as the most economical and environmentally friendly mode of hauling goods over long distances..  But there is little question that Mr. Buffett's purchase of Burlington Northern has added a shine to the appeal of railroad stocks that wasn't there before.

That shine may be in the process of dulling a bit.  Our Dividend Valuation model for Union Pacific  (UNP) shows an interesting feature that we have seldom seen for any stock since the beginning subprime crisis: overvaluation.

The chart shows that UNP's current price (red line) is just over $85 per share, more than 15% above our model's current predicted value, and nearly 8% above next year's predicted price. (The other major rail stocks show similar overvaluations)  

As we have said before, overvaluation and undervaluation are not precise fall-off-the-cliff events.  Stocks can stay overvalued or undervalued for a long time.  But a look at UNP's valuation model shows that it has rarely been significantly overvalued: only 4 times in 20 years.  Each time it became overvalued its price ultimately fell back to its valuation bar. 

We doubt if the current momentum in the rail stocks gives a hoot about our valuation models, but we don't have to remind anyone that stocks get undervalued and overvalued and eventually they return to their value tracks.


A relative of the author owns UNP.  Please do not use this blog for investment decisions.  Please consult a licensed investment professional.

Thursday, October 07, 2010

Utility Watch: Still Waiting For The Breakout

As I said last time, we are watching the utility sector for clues about the future course of stocks overall.  The good news is that last week the Utility Sector (XLU) made a new 2010 high.  The not-so-good news is that its price did not exceed the December 2009 high. 

Utilities are a key indicator because they possess two important qualities.
  1. History shows us that they usually lead stocks out of bear markets and corrections.
  2. They are in the category of bond-like stocks that has been doing very well in recent months.
The bond-like qualities of utilities may be the most important indicator in the current market.  Bond prices continue to surge, with the 10-year T-bond now yielding under 2.5%.  By contrast, the current dividend yield of the utility sector (XLU)  is approximately 4% and, according to Bloomberg, has produced dividend growth of over 5% per annum over the past five years. 

I was modestly disappointed that XLU did not pop north of the December 2009 high in last Friday's big up move.  However, hot markets do not usually draw lots of investors to the slow-moving utilities; thus perhaps Friday's action should have been expected.

Another reason I am so interested in the utilities is that they are widely owned by individual investors.  A continuing uptrend in XLU would suggest that individuals may be accumulating their old faithful sector.  The other old-faithful dividend sector, banks, has completely betrayed the individual investor with dividend cuts and continued turmoil. 

If the utilities keep moving higher and break above their old high, it would not stretch the imagination to think that they might continue to move higher than most people now believe.  The reason is simple:  There are not many sectors of the stock market that have treated long-term investors very well in recent years.  The old favorites, health care and banks, have both let investors down over the last decade.  Only the utilties have provided a solid return during this time.

Our Dividend Valuation models are suggesting that utilities are as much as 25% undervalued.  Maybe just maybe, this industry has it affairs enough in order that they will pierce their 2009 highs and break into new territory.  That is what we are counting on.

Thursday, September 23, 2010

Donaldson Barnyard Forecast is Positive for Stocks

Randy Alsman, VP and Senior Portfolio Manager, describes the most recent reading from our proprietary Barnyard forecast and explains how we arrive at the scoring.


This is a video/audio webcast. If you are unable to view this post, click here.

Rising Dividend Investing
http://www.blogcatalog.com/directory/business/investing/stocks/

Sunday, September 19, 2010

Southern Company Looks Undervalued

We believe many high quality, dividend-paying companies are very attractive compared to US Treasury bonds.  We have previously described the concept we call "bond-like" stocks.  Bond-like stocks to us mean companies that
  1. Have strong balance sheets 
  2. Have a history of paying dividends
  3. Display a history of raising its dividends,and
  4. Possess dividend yields that are close to the yield on a 10-year US Treasury bond.  
 We have previously written about two such companies, Procter and Gamble (PG) and Royal Bank of Canada (RY).  The third stock in this series to meet the bond-like stock criteria is Southern Company(SO).  SO is one of the nation's largest electric utilities, and we believe it has a lot going for it that is being ignored by investors.

Our Dividend Valuation Model above (click to enlarge), which is based on the relationship between SO's price versus its dividend growth and the level of interest rates on long US Treasuries, suggests that the stock may be undervalued.  Indeed, the model is projecting that the total return of SO over the next 12 months may approach 17%.  As we always say, our model is based on historical relationships and thus is certainly not a guarantee of the future, but we are inclined to believe that SO is positioned to do well over the next year.  Here's why:
  1. SO's bonds are A rated by both rating agencies, among the highest rated utilities in the US.  
  2. It is the second largest utility in the US and the largest in the Sunbelt, where the population is still growing.
  3. SO has a near monopoly in its service areas and produces power through a diverse array of power sources from coal to nuclear power.
  4. SO has generated a 14% annualized return over the last 10 years, far outpacing the S+P.
  5. The company has paid a dividend since 1948, and its current dividend yield is just under 5%.
  6. SO has raised its dividend for 9 consecutive years at an annual rate just over 4%.
Our conclusion:

SO sells a product necessary for our daily lives and is as well run as any utility in the US.  It has a current dividend yield of nearly double that of the 10-year Treasury bond.  SO's implied return of 9% (5% dividend yield plus 4% dividend growth) compares favorably to the 10-year Treasury yield of 2.75%.

We believe the recent aversion to risk that has gripped the markets can not last forever. As investors realize that they cannot live very well on CDs paying .3%, they will begin looking for quality alternatives, and the first place they will look will be the electric and natural gas utilities.  When they start looking at the utilities, it will be hard to beat what they find in Southern Company.

Clients and principals of Donaldson Capital own SO.  Please see Term and Conditions of this blogsite on the right sidebar.
                                

Saturday, August 28, 2010

Answers to Your Questions: General Mills -- How Our Dividend Model Gives Buy and Sell Signals

Dividend Valuation Model
General Mills (GIS) is up 22% over the last twelve months.  A questioner wants to know what our dividend valuation model is signaling about the stock's prospects for the coming year.  In addition, several questioners have asked if we are a pure "buy and hold" manager, or if we take profits under certain conditions. 

In answering the second question first, we are not a "buy and hold" investment manager.  We are a "buy undervalued and sell overvalued" manager.  We find that our average holding time of a stock is about 5 years.

Let's use our Dividend Valuation chart above of General Mills (click to enlarge) to look more closely at the buy and sell signals we believe have the most validity.

First a cursory looks reveals that over the past 20 years there has been a reasonably tight fit between the movement of GIS's price (red line) and its projected valuation (blue bars), as calculated by our Dividend Valuation model.  Indeed, the R2 is near 90%.  It is important to remember that the Dividend Valuation model calculates a single formula that is used for all years, with the only difference from year to year being the inputs of dividend growth and changes in interest rates.

So how do we read GIS's prospects for the coming year?  The checkerboard bar at the far right is the model's calculation of the predicted price using our projections of GIS's dividend growth over the next twelve months and the change in the yield of a 30-year US Treasury bond. That predicted price is approximately $40 per share. If we include GIS's dividend, that would produce an approximate total return over the coming year of near 12%.

As a reminder, while our model has done a good job of predicting value over the last 20 years, the model is based on historical relationships and, thus, is not a guarantee that GIS's predicted price of near $40 per share will be met.  You probably knew that already.   

Let's look more broadly at GIS's valuation chart to see the various buy and sell signals it has made.  Remember the actual price is the red line and the model's predicted price is the blue bar.  Thus, simplistically, when the red line intersects a blue bar in a particular year, that would mean that price is below value, and it would signal that the stock is undervalued and a buy candidate.  Conversely, if the red price line is higher than the top of a blue bar it is considered overvalued, and a sell candidate if owned.

According to the model, GIS was undervalued between 1993 and 1998,  in 2000, 2005, 2009, and 2010.  Simply speaking, if we were following the model without other considerations, we would have bought the stock in 1993 and sold it in 1999.  We would have bought again in 2000 and sold in 2001; repurchased it in 2005 and sold again in 2006.  Finally, we would have bought in 2009 and we would still be holding the stock.

In actual practice, we follow a more rigorous standard for buying and selling.  In the case of a stock like GIS, we require that the stock be at least 10% undervalued or overvalued to trigger buy and sell signals.  We find this provides about the same rate of return with far less turnover and capital gains taxes.

We do not currently own General Mills in any of our Rising Dividend models.  We have looked at it many times over the years, but other stocks appeared to be more undervalued each time.  Indeed, its current 12% undervaluation is not exceptional.  Our models are suggesting that the average stock is nearly 25% undervalued.  GIS is an outstanding company, and if it retreats in price or begins to grow its dividend at a higher rate than our model now projects, we would become much more interested in buying it.

We'll be tackling some of the questions about the economy and the Federal Reserve next week.

The author does not own General Mills.  

Saturday, August 14, 2010

Royal Bank of Canada is the Epitome of a Bond-Like Stock

In these uncertain times, we are asked over and over by our clients : "How can I invest in the stock market with less volatility and more predictability?"  Our answer is: "By investing in Bond-Like Stocks."

Bond-Like stocks aren't for everyone, but once you get to know them, you might find they are just what you have been looking for.  In our last audio blog (see link) we introduced the concept of Bond-Like stocks.  These are stocks that have very high financial strength and credit ratings, a dividend yield higher than that of a 10-Year US Treasury bond, and a history of raising their dividends. 

Royal Bank of Canada (RY) probably fits these criteria as well as any stock I can think of.  Here are the particulars for RY.
  1. RY is one of 5 AAA rated companies in the world.
  2. Its current dividend yield is 3.9%, much higher than the 2.8% yield on a 10-year T-bond.
  3. It has raised its dividend an average of 10% per annum over the last 10 years.
In addition, RY, along with all the other Canadian banks, largely escaped the subprime crisis as a result of its conservative lending practices.

A look at Royal Bank of Canada's most recent earnings report reveals some very interesting data points.
  1. Quarterly allowances for loan losses were 48% lower than a year ago.
  2. Shares outstanding were almost flat, very different from big US banks which increased shares by up to 35% to meet government mandated net capital requirements.
  3. Total loans grew modestly, again contrasting the shrinking loan balances at most US banks.
  4. Perhaps the most striking data point was RY's return on equity (ROE).  ROE for its second quarter was near 17%, almost as high as its 10-year average and almost double that of the big US banks.   
At the above right is our proprietary Dividend Valuation Mode for RY (click to enlarge).  The model suggests that the company may be as much as 14% undervalued, based on the year-ahead dividend growth we project.  As we have said before, the Dividend Valuation Model is based on historical relationships of price versus dividend growth and changes in interest rates.  These relationships may not hold true into the future, but on a historical basis the model has been able to predict the annual movement in the price of the stock at near 90%.

We'll have more to say about Bond-Like stocks in the coming weeks.  Next time we'll describe the hidden value of rising dividends.
Clients and principals of Donaldson Capital Management own RY.  See the conditions for use of this blog site at the right.