Showing posts with label bonds. Show all posts

Wednesday, June 15, 2022

Paul Volcker Taught Us How to Tame Inflation

I started writing a monthly investment update for the investment firm I was with in 1975. I didn't know what I was doing at first, so the older people in the firm would feed me what to say, and I would write the update.  This was just a few years after the OPEC oil embargo and inflation had shot higher. As the months rolled on and inflation continued to rise, I found fewer and fewer of the old-timers were stepping up to tell me what to say, so I became a student of the Federal Reserve in order to have something halfway intelligent to say. That was no help for several years.  Inflation remained persistently high. At times, prices changed on grocery shelves and gas pumps while I was standing in front of them, ready to make a purchase.  Interest rates kept going higher and higher, and none of the Federal Reserve's rate hikes seemed to make any difference.  

An inflation mentality set in on Wall Street, Main Street, and Ivy Street. Inflation became a way of life. We had silly government programs such as Whip Inflation Now (WIN) and a lot of other kinds of cute sloganeering that was not rooted in any economic truth because very few people really understood inflation and how it worked. 

We all became followers of the money supply.  M1, M2, and M3 discussions went on at social gatherings like somebody somewhere knew what it all meant.  "Too many dollars chasing too few goods" became the wink and a nod answer to all things inflation.

There was one man who did understand what drove inflation and how to control it. His name was Paul Volcker. Volcker was promoted to chair of the Federal Reserve in 1979. He immediately began a series of rate hikes that would drive the Fed Funds rate up from around 11% in September 1979 to 20% in March 1981. The 6’7”, cigar-chopping man taught us all that in dealing with inflation, the right course of action was to use a leading interest rate strategy instead of a lagging strategy.  In effect, Volcker made it clear verbally and by his actions that wherever inflation went, he would push interest rates even higher. His leading strategy was truly remarkable, and it broke the back of the inflation panic that had been raging through the economy for years. Inflation peaked at 14.8% in March of 1980 and by 1983 had fallen below to near 3 %. 

Today, we face another inflation crisis and the same 'we got this thing under control' illusion that I watched play out for years in the late 1970s.  Modern Monetary Theorists, who spoke so boldly of 'we got this economic thing' and advocated dumping huge quantities of dollars onto anyone who could breathe, have become silent. They should have done so much sooner.

Inflation is as much of a psychological phenomenon as it is a monetary phenomenon. The present Fed has been saying 'we got this thing' for too long.  They are losing both the psychological battle as well as the monetary battle. They must come out of today's meeting with two huge changes in what they say and what they do.  First,  they must say "Paul Volcker taught how to tame inflation, and we are now following his playbook." Second, they must raise Fed Funds by at least 1% and promise even more 1% hikes in the future. Jerome Powell must ignore the politicians, jump straddle inflation, and fight it with tools history shows us have worked.  If he continues to bow down to the politicians and make small interest rate hikes, we may be fighting inflation four years from now.

I believe the stock market understands what needs to be done and will soon find a bottom if the Fed takes a tougher stance. If the Fed keeps nickleing and diming us along, stocks will likely keep falling because big investors know that the longer we allow the current lagging interest rate strategy to prevail, the worse will be the ultimate recession.

The illusion of 'we got this thing" should end today."         


Sunday, February 10, 2019

Volatility Will Continue, But Stocks Are Going Higher


After an historic January run, the S&P finished the first full week of February in what looks to be a consolidation phase.  As we thought might be the case, the S&P 500's 200-day moving average has proven to be a level of resistance for the market with a sharp pullback off the moving average in the middle of the week.  Still, an impressive intraday rally took hold on Friday to see the market close well off its morning lows.  Late Friday rallies have been a good sign during the last couple of years and continue to suggest that buyers abound at these levels.  So while stocks may face a battle as they try to work through the 200-day moving average, the outlook is constructive for the longer-term and there are decent levels of technical support close by.  This is born out by the surge in the percentage of stocks above their 50-day moving averages, which typically results in strong returns over the next 6 to 12 month time frame.  Importantly, strong  stock gains in January's tend to beget strong full-year performance. 

Economy and Bonds

From a macro standpoint, the economic data continue to be more mixed, but that is probably the best case scenario for stocks grinding higher.  US economic data softened significantly at the tail end of 2018, but a small rebound in the Mfg. PMI and last week’s stellar jobs report have tempered the recession talk.  Still, consumer confidence has taken a hit, and business investment is rolling over a bit.  With the recent mix of data and little inflation in sight, the Fed is probably on hold, and the cacophony of economic naysayers has been quieted.  On that note, credit spreads have stabilized and more of a risk-on attitude has been evident.  What is perhaps most striking in the recent upleg in stocks has been the behavior of US 10-year bond yields.  One might think that a more lax Fed would allow inflation and growth expectations to creep higher, taking interest rates with them; but global economic woes are keeping inflation expectations and bond yields in the US well anchored.  The US's expected GDP growth in the 2%-3% range for the year ahead looks downright rosy compared to much of the rest of the developed world.  We believe this realization has not been lost on foreign investors.

Trade

Trade remains an issue as gamesmanship has once again emerged between the US and China as tariff deadlines draw near.  Of great concern is the February 17th deadline with the Eurozone that could lead to the imposition of tariffs on European autos.  These tariffs have the potential to wipe out a good deal of the incremental tax cuts in 2019.  This is an area to watch as well.   

Earnings

Here's a quick update on fourth quarter earnings: With 66% of companies reporting, earnings have surprised by an average of around 3%.  Revenue growth of 6.5% has contributed to earnings growth of 14% year over year.  Fourth quarter earnings continues to look better than expected; however, expectations for Q1 earnings growth have softened.  This is likely a symptom of the slower global growth.  Still, there are pockets of strength that are relatively immune to the global slowdown. In our next blog we will discuss a few of the superior operators.  

Finally, our overall valuation model says stocks are still in a sweet spot and should end the year higher than they closed on Friday.

Preston May, Certified Business Economist
Research Analyst
Donaldson Capital Management, LLC.
Editor Greg Donaldson

Monday, July 28, 2014

This B-U-L-L Market Is Getting L-O-U-D

Throughout the history of the U.S. stock market, there have been many bull and bear markets. Studying these market cycles can teach investors a great deal about how the market behaves and the underlying reasons behind it.  If you can identify the driving forces of a bull or bear market, you can make more intelligent decisions to either protect yourself against a looming bear market or take advantage of a bull market.

In the 20-year history of our firm, we’ve seen several of these market cycles and have studied countless others.  While no bull or bear market looks exactly the same, the past provides us with useful insights about the future.  In the words of Mark Twain, “History doesn’t repeat itself, but it does rhyme.”

Today, we are going to see how the current bull market “rhymes” with years prior and what information we can gather from its historical patterns.

Anatomy of a Bull Market

The anatomy of almost all bull markets can be broadly defined by four primary characteristics that make up the acronym B-U-L-L, which you can read more about here.

1. Breadth
2. Unrelenting
3. Leadership Rotation
4. Loud

The “Loud” part of the equation is of particular interest in today’s market.    Bull markets attract a lot of attention from media and Wall Street.  Everywhere you turn, it seems like you hear about the stock market.  The local newspaper, CNBC, Wall Street, and even outings with family and friends can turn into investment discussions.

That’s typical of bull markets.  They grab you and force you to pay attention.  For all of those investors who have been out of the market since 2009, the run-up in stocks over the past five years has shown them just how wrong they have been.

Bull markets attract their fair share of commentators on both sides of the fence.  Some say the bull market will keep going, while others continually predict it’s demise.  The longer the bull market goes, the louder the shouting on both sides become.  Amongst all of the noise, it’s difficult to discern between what is truly relevant information and what is just that - noise.  

A lot of the chatter lately has been speculation about when the current bull market will end.  If you look back on nearly every bull market we have ever had in the United States, you will find that the vast majority of them don’t die of old age, they are killed.  There are two primary killers of bull markets:

(1) Recessions

Pullbacks and corrections can occur at any time, but it is really difficult to have a real bear market unless there is an economic recession that negatively impacts company fundamentals.  Remember, prices will always follow valuation in the long-term.  So if long-term values are increasing, the long-term trajectory of the stock market should also be increasing.

The majority of the data we see coming out of the economy have been very positive.  We thought the Q1 economic data were mostly weather-related, which turned out to be correct.  Employment numbers have improved significantly.  The economy has now added at least 200,000 jobs for the past five consecutive months.

As the economy starts to heat up, we should see increased activity from consumers and better sales growth for U.S. corporations.  Unless there is an unforeseen major geopolitical issue or natural disaster that disturbs the global economy, neither our Macroeconomic Team or the economists we follow foresee any recessions on the horizon.

That leads us to the second major killer of bull markets...    

(2) The Federal Reserve  

In the absence of any major economic shocks, the Fed is the primary suspect in the death of most Bull Markets.  

When interest rates are low, investors look outside the safety of U.S. Treasuries and into more traditionally risky assets such as stocks.  As the stock market increases from the inflow of funds, people begin to experience the “wealth effect” from watch their account values go up.  As consumers feel more wealthy, they increase their spending, which puts upward pressure on capacity.  To meet the rising demand, businesses hire more people and invest in new factories and technology to push up supply. When the Fed raises interest rates, the opposite tends to occur.

Even when the Fed raises rates, however, the stock market has historically been very slow to respond. Looking back to previous bull markets, it has taken several months of interest rate increases before the stock market has had any meaningful reaction.  This is not to say that this time will be the same - but it does contradict the widely held belief that the stock market will be hurt by the Fed raising short-term rates in the coming year or two.  Using history as our guide, that just doesn’t seem to be the case.

Furthermore, the small body of evidence we have about Federal Reserve Chair Janet Yellen suggests that she isn’t going to be quick to raise interest rates. Yellen believes wholeheartedly in the Fed’s dual mandate of both maintaining price level control (inflation) and in promoting employment.  As long as the economy continues to have above average unemployment, it is very likely that Yellen will push the Fed to keep rates low.  And as long as rates stay low, there is nowhere for investors to go but stocks.

When Is The End?

While we would consider ourselves to continue to be optimistic about the future of stocks, we certainly are not raging bulls.  We know that all bull markets must come to an end at some point, we just don’t believe that will happen in the near-term.  

While no one can know for sure when the bull market will end, there are often signs that start show up ahead of time.  One of the things we look for are the “one percent days.”  If stocks start moving up rapidly with a series of these large increases, that is likely a sign that Mr. and Mrs. America are starting to get tired of sitting in cash.  As they pour into the market, the buyers dry up and leave nothing but sellers.  On the flip side, a long string of negative one percent days typically indicates that the market is going through more than just a batch of profit taking.

We get a lot of questions about what we would do if we sense weakness in the market.  When we see potential trouble on the horizon, we don’t just immediately move to cash or try to time the market. We find it in our clients’ long-term interests to “take air out of the ball.”  

If things were to get rowdy, we would strategically reduce more volatile positions (“A” stocks) and look to add more “Royal Blue (RB)” stocks to stabilize our portfolio.  This does two things: (1) it reduces the volatility of our portfolio and (2) provides solid earnings growth and dividends to get our clients through the worst of the storm.  In bad markets, the RB stocks become defensive strongholds.  They are so big and strong that they can absorb huge amounts of shock without damaging the intrinsic value of their businesses.

Current Outlook

At this moment, we don’t see much sign of weakness. Despite the geo-political issues in Russia, the market has continued to move higher.  If shooting planes out of the sky doesn’t spark even a small pullback, that’s a pretty strong indicator that the market can continue to drive north.

Valuations for some companies are getting frothy, but the overall market is about fairly valued and well within its normal statistical range.  With interest rates so low, even higher valuation multiples than we are currently seeing would not be out of the question. While that’s a possibility, we don’t anticipate getting any additional return from valuation multiple expansion.  


In our opinion, stocks are likely to return what they generate in net earnings and dividend growth over the next 6-12 months.  If Q2 earnings are any indication, growth is starting to accelerate along with the economy.  As long as the companies continue to be the stars that they have been, this bull market still has strength to keep charging on.

Wednesday, July 09, 2014

What About Bonds?, Part II: Inflation and Interest Rates

This is the second installment in a series of blogs aimed at providing answers to our most frequently asked questions regarding bonds, interest rates, and inflation.  The format is Q&A. Nathan Winklepleck, co-editor of the Blog, is moderating the discussion by sharing these inquiries with Joe Zabratanski, Senior Fixed Income Manager, and Greg Donaldson, Chief Investment Officer.  

Nathan: There is a lot of jargon in the fixed income world. I think it would be beneficial to our readers if we began by defining "inflation" and "interest rates" and explaining what each one means in this context.

Joe: Great idea.  I’ve found over the years that the term “interest rate” can mean many different things to many different people, so before we get started, let’s make sure everyone is on the same page. An “interest rate” is simply the rate charged by a lender to a borrower for the use of money or an asset. The term applies to many investments including the interest rate on U.S. savings bonds, bank certificates of deposit, savings accounts, home mortgages, and car loans.  From an investor standpoint, interest rates are the rate of return we are paid in exchange for lending money to a business or government. The interest rate in this context can vary significantly depending on the maturity date (length of time until we get our money back) and the risk of default (the possibility that the borrower will be unable to repay our money). Today’s discussion will focus on  interest rates as they relate to U.S. Treasury bonds.

We can define “inflation” as the rising price level for goods and services. If the groceries in your shopping cart cost $100 in Year #1 and inflation for that year is 2%, those same items will cost $102 the next year. Over time, your original $100 will purchase fewer and fewer groceries. You can think of inflation as the general decline in the real purchasing power of money.

Nathan: In the last installment we discussed the inverse relationship between bond prices and interest rates. You described it as a teeter-totter effect: as interest rates fluctuate up and down, bond prices move in the opposite direction.  What is the relationship between interest rates and the level of inflation?

Thursday, June 19, 2014

Fixed Income, Part I: Relationship Between Interest Rates & Bond Prices

With interest rates at historic lows, and the Fed saying they will keep short rates low for an “extended time,” there is much confusion among financial pundits as to where interest rates and bond prices are headed in the coming years. With so much disagreement among the experts, many of our clients have asked that we provide an in-depth discussion of our views on inflation and interest rates, and the path these rates may follow in the coming years.

Although we regularly answer these questions in our client meetings, using our blog allows us to quickly explain our current views and strategies to a larger audience.

This particular series of blogs focuses primarily on the bond market; beginning with the basics before tackling the more complicated issues.

The format is Q&A. The first installment is a brief analysis of the fundamentals of bond investing, which we hope will build a solid foundation of understanding as we move forward. Nathan Winklepleck, co-editor of the blog, has assembled a list of our most frequently asked questions. He will serve as the moderator for the Q and A and will ask Joe Zabratanski our Senior Fixed Income Manager and Greg Donaldson our Chief Investment Officer to provide answers and commentary.

Q: Nathan: We have received several questions from clients about the impact of changing rates on bond prices.  Could you explain the relationship between interest rate fluctuations and fixed income prices?  How and why does one influence the other? 

Friday, May 03, 2013

Citizens of Bondsville: Welcome to Dividendsville

Many in the financial media are wringing their hands that the current bull market in stocks isn’t acting right.  "It’s too defensive," they say.  Put another way, they believe the wrong kinds of stocks are leading this bull; therefore, it is not to be trusted.  Nothing could be further from the truth.  One day these growling bears will admit they are wrong and come charging into this bull market.  That will be the sign for us believers to know it’s time to leave.  But, our guess is that time is a long way off.

The right stocks for a normal bull market are the so-called cyclical stocks – Basic Materials, Financials, Consumer Cyclicals, Industrials and Techs.  These kinds of companies sell products that last for three years and longer.  An uptick in these sectors of the stock market would mean that new incremental buying is occurring in these “long-term” sectors and would mean that big employment gains should be very near.

The leaders of the current uptrend in stocks are the defensive stocks – Consumer Staples, Healthcare and Utilities.  Companies in these sectors sell products we buy and use every day -- think of Procter and Gamble as the epitome of a defensive stock and Caterpillar as its counterpart.  One can’t put off the purchase of Crest toothpaste nearly as long as they can put off buying a new D9 earth mover.

Today’s bull market is not a classic bull market from the perspective of what kinds of companies are leading the pack, but it is a bull market nevertheless.  The easiest way to think of it is as an asset-allocation shift bull market.  As the Fed has continued to keep interest rates near zero, more and more investors have decided to flee their poor treatment in Bondsville to head for better returns in the suburbs.  They have traveled through the nearby communities of Junk Bondsville, Preferred Stockville, and - in recent months - have been moving into Dividendsville.

They have said, “I would rather take the risk of owning the common stock of Procter and Gamble or McDonalds than accept a 1.6% taxable return from a 10-year U.S. Treasury Bond.”

Certain types of large, multinational stocks are now being seen as having less risk than U.S. Treasury bonds.  The math is simple:  On an after-tax, inflation-adjusted basis the 10-year Treasury is a sure loser over its lifetime.  That’s not even considering the sad shape U.S. Government finances are in today.  On the other hand, Procter and Gamble (PG) and McDonalds (MCD) are companies that have taken on all comers and are not only still standing, but prospering.  Both have dividend yields near 3%.  

PG has paid a dividend since 1891 and raised it for 59 consecutive years.  PG’s dividend has risen at an annual rate of over 8% during the last three years and over 9% in the last five years.  At an 8% growth in its annual dividend, PG’s dividend will double in nine years.  Even if PG’s stock price does not move a penny over the next nine years, its dividend yield will rise to 6% - based on today’s price.  Its internal rate of return would be about 4.5% from dividends alone.

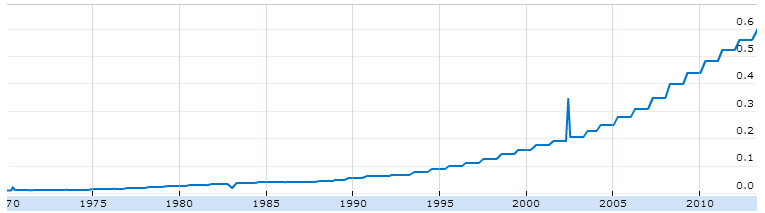
Proctor & Gamble (PG) Dividend since 1970
MCD’s dividend growth of near 12% per annum over the last three years and 3-5 year projected growth rate are both higher than PG’s.  

Procter and Gamble and McDonalds are not the only members of Dividendsville.  There are nearly 100 (and growing) companies worldwide that are becoming viewed as being safer than governments.

You won’t find these kinds of companies standing in line for government hand outs.  Indeed, it is the taxes these companies pay year after year that the U.S. government is so anxious to give away.

These companies cannot create income through taxation, but they can do something even better – compete.  They balance their books every year.  They navigate the byzantine regulations in every country in which they do business.  They hire and train employees for jobs that have a future.  They innovate.  They take risks.  They give back to every country and community in which they do business.  And - most importantly - they build flexibility into their decision-making that allows them to be profitable nearly every single year. 

Compared to bond yields, the current dividend yields of PG, MCD, and a host of other similar companies are actually higher than they should be.  If the current slow growth economy continues through the end of this year, we believe dividend yields for these kinds of companies will fall to nearly 2.5%.  For dividend yields to fall despite rising dividends for these companies, it would mean their stock prices would have to rise 15% or more between now and then. 

This might seem like an overly aggressive view of the performance potential for these stocks, but there is a line forming in the heart of Bondsville that stretches as far as the eye can see.  They are leaving town.  Whether or not they know it now, they will find their way to Dividendsville.  When they do, they will never leave.   


Our clients and staff own MCD and PG.

This discussion is provided for information purposes only.  Please consult your investment advisor concerning any ideas expressed here.  

Wednesday, June 20, 2012

Bond-Like Stocks Are Still Winning


We regularly slice and dice the S&P 500 to determine what general categories of stocks are doing well.  Periodically, we do what we call a strategy check.  Simply put a strategy check is an analysis of the three or four investment criteria that we believe are at the core of our Rising Dividend investment strategy.  The following is a brief discussion of the criteria we follow most closely and how companies with those characteristics have fared over the past twelve months.

Quality:  As we have detailed many times in these blogs, our investment selection process begins with the quality door.  Except on rare occasions, we invest only in companies whose bonds achieve at least an investment grade rating by one of the major rating agencies.  The reason for this is obvious:  sooner or later, tough times come, and when they do winnings stocks are almost always found among companies with good credit histories and ratings.

The following are the 12-month median total returns of the S&P 500 companies broken down by ratings.                  


Rating
Median Total Return
AA-AAA
12.8%
A
4.8%
BBB
4.0%
B-BB
-10.5%
NR
-1.8%
Standard and Poors 500 Index
3.72%

The last twelve months have been a roller coaster ride for stocks of monumental proportions.  In this kind of environment, it is not surprising that the higher quality stocks have performed well versus lower rated stocks.  It is a bit surprising that the total returns by bond rating are so symmetrical.  As we have noted before, the stocks in our Cornerstone investment strategy have an average bond rating of A+.  


Dividend Yield:  After a stock makes it through the quality door, the first thing we look at is its dividend yield.  Dividends are cash money.  Dividend payments place a premium on a management team that focuses on the proper balance between the cash flows necessary to pay the dividends and the capital expenditures necessary to keep the cash flows growing.  In short, dividends require a disciplined management team.  We think this means that most companies who pay a regular dividend are less likely to be taking wild-eyed fliers with our money. 

Dividend Yield Quintiles
Median Total Returns
Top 100 Dividend Yielders
8.2%
2nd 100 Stocks
4.7%
3rd 100 Stocks
2.4%
4th 100 Stocks
3.8%
5th 100 Stocks
-1.6%

It is not surprising that the median returns of high yielding stocks are showing good results.   Bond yields are historically low, and people have been moving to higher yielding stocks in a steady stream.  What is surprising to us, again, is that the results are nearly symmetrical.  We believe this might be a cautionary signal.  Many high yielding stocks we see on the list of top performers have very little dividend growth and are presently borrowing money to pay the dividend.  That is not a good sign and could signal some dividend disappointments in the year ahead.  That is the reason we focus so intently on dividend growth. It is the best way we know that a company can offer tangible signals about it future prospects. Talk is cheap, but dividend hikes mean a company's money is where its mouth is.

Dividend Growth:  We learned a long time ago that dividend yield alone is not enough; dividend growth also plays an important role in the long-term performance of a stock.  The following tables show the median total return over the past 12 months of stocks in the S&P 500 sorted by dividend growth quintiles. 

Dividend Growth Quintiles
Median Total Returns
Top 100 Dividend Growers Last 12 Months
4.8%
2nd 100
5.9%
3rd 100
7.6%
4th 100
2.5%
5th 100
-8.1%

The table shows that investors have not rewarded the top dividend growth companies that are located in quintiles 1 and 2.  Investors have been buyers of the lower dividend growers in quintile 3.  A closer look at that group is very revealing.  The average dividend yield for the stocks in quintile 3 is 3.4% and the average annual dividend growth is 5.9%.  This compares to the S&P 500 where the dividend yield is approximately 2%, with dividend growth last year of near 10%.  

It is important to note, that while quintile 3’s slower dividend growth was the top performer, quintiles 1 and 2 also outperformed the S&P 500 total return of 3.7%.  That is also the the case in our Cornerstone investment strategy.  The 30 stocks in that portfolio have a current yield of 3.5% and dividends grew last year at just under near 10%.        

Our bottom line summation of what this strategy check is telling us is that, indeed, in this low interest-rate, slow growth environment our concept of “bond-like” stocks is still a winning strategy.  The markets are rewarding higher quality over lower quality.  Investors are buying dividend yields that are higher than bond yields and are favoring current yield over dividend growth, although companies with high dividend growth are outperforming the average stock.  We have spoken about these bond-like stocks in several previous blogs.  Please access these links,1. Bond-Like Stock Audio, 2. Bond-Like Stocks, to see and hear a more expansive discussion of why we believe this concept is working and will continue to work.


Friday, February 10, 2012

To Dividend or Not to Dividend, That Is the Question?

To dividend or not to dividend, that is the question?  In 2011, most of what we have been saying about dividend stocks for the last 15 years came into full view for everyone to see.  In a weak stock market, the cash payments distributed by dividend-paying companies were more highly valued than betting on the come with the non-dividend payers.  During most of the year, the dividend yields of many stocks were higher than the yield on a 10-year U.S.Treasury bond.  This fact alone lifted many consumer staple, energy, health-care, and utility stocks.  Taken as a group, dividend-paying stocks significantly outperformed non-dividend paying stocks.

In 2011, dividend-paying companies, particularly those that have a history of consistently raising dividends, gradually were seen to be bond substitutes.  This is due to the compounding effect of rising dividends.  A company with a 3% dividend yield today will be yielding 6% in ten years if its dividend grows at a 7% annual rate.   A company yielding 2% today with its dividend growing 12% per year will yield near 7% in 10 years.

During the year, dividend paying stocks became the equity asset of choice.  There was almost a perfect symmetry between dividend yield and total return:  The higher the stock's dividend yield, the higher was its total return for the year.  For example many utilities enjoyed total rates of return of 15% or more in a year when the S&P 500 grew by about 2%.

But here in 2012, the robust early gains for the S&P 500 (5%) and the Global Dow (10%) have presented investors with a very difficult question:  Do we continue to focus on the "knowns"of dividend investing, or do we abandon them for the  "unknowns"  of gut feelings and hot tips?

The reason this question is so important is because the impressive stock market gains in the new year have caused many strategists to raise their estimates of 2012 stock market performance to 15% or more.  A 3% dividend yield looks good in a 2% stock or bond world, but it does not stack up so well against 15% returns.  Because of this many articles have been written arguing its time to move away from dividend investing and start pursuing growth again.

We would argue that dividend paying stocks are likely to perform just as well as non-dividend payers, even if stocks rise by 15%.  The reason is simple, our valuation models now predict that the average stock in our portfolios, which has a 3.5% dividend yield, is undervalued by almost 25%. You must remember, we focus on rising dividends.  To achieve a steady stream of rising dividends, a company must also have a solid stream of growing earnings.

In short "To Dividend or Not to Dividend" may be a false question.  Dividend-paying stocks can offer market-type returns when stocks grow by up to 15%.  In our experience, dividend-payers only begin to lag the overall market when the S&P 500 grows by 25% or more.  Even then, they will get most of the gains.

Considering how well the dividend payers do in down markets, and in view of all of the uncertainties in the world, we still believe "To Dividend" is the right answer for most people.    

We own dividend-paying stocks.

Friday, October 21, 2011

12 Random Ramblings

Every working day of our lives we get questions.  Questions about the stock and bond markets.  Questions about how natural disasters, politics, or economic and business crises will play out in the market place.

In this weekly blog we try to keep our comments narrowly focused on our dividend investment strategy.  As we were composing our most recent quarterly letter we admitted to our readers that at times we sound like a one trick pony:  our solution for every challenge and every opportunity is always -- buy and hold quality rising dividend stocks.  In the long run we know that will work.

Yet the matters we discuss and decide at our weekly investment policy meetings cover the waterfront of issues.  In this regard, heaven help us, we are like politicians because we have to have a basic understanding and a few talking points on just about everything that is going on in the world.  

We thought our readers would appreciate our short takes on a long list of issues facing our nation and the world.  Normally, when we write these blogs or our client letters, we try to offer solid proofs for our positions.  In this piece, we are not going to do that.  We are just going to give our views, without supporting arguments.  This way we can cover a wide range of issues that you may have questions about.  It is our plan to periodically offer an update to what we are calling 12 Random Ramblings from the Investment Policy Committee.
  1. Stocks are undervalued by about 25%.  Energy, Industrial, and Consumer Cyclical stocks are very cheap.
  2. US Government bond yields are at historic lows, but will not rise much over the next year.
  3. Inflation will fall.
  4. US Corporate profits will continue to surprise to the upside, driven by business in developing nations.
  5. Greece is already bankrupt, but the European Union will keep the country on life support for an extended time.
  6. The market has already priced in a Greek default.
  7. The US economy will not fall into recession and may surprise to the upside in the fourth quarter of this year.
  8. The worldwide economy will grow by at least 3%, after inflation, this year.
  9. Dr. Doom, Nouriel Roubini, has signaled better times may be on the horizon for the US and the world by putting his investment advisory firm up for sale. 
  10. The average dividend payout ratio for the S&P 500, which is now, under 40%, will move back toward its 80-year average of 50% over the next five years.
  11. There is still a chance that Hillary Clinton will run against President Obama if his polling numbers don't improve by December.  She would likely beat any Republican, and the stock markets would rally, not because her views are so much different than Obama's, but because the economy and the markets did so well under Bill Clinton.
  12. If  Roubini is selling his company, the price of gold may have already seen its highs.

Greg Donaldson, Chairman of the Investment Policy Committee
Donaldson Capital Management, LLC

Wednesday, August 10, 2011

Are Dividend-Paying Stocks Becoming Better Than Bonds?

Speculators are throwing stocks around like dead fish, but even a simple analysis of companies in the S&P 500 shows that they are very much alive.  There are now 214 companies in the S&P 500 that have a dividend yield higher than the 2.10% yield of a 10-year US Treasury bond. 

These 214 companies have an average current dividend yield of 3.70%.  Importantly, as an indicator of their vitality, these companies have increased their dividends by an average of 8.20% over the last 12 months. This level of dividend hikes is eye-popping when considering that the US economy grew at only 1.60% during this time.

For the S&P 500 as a whole, the current dividend yield is 2.25%, also higher than the 10-year Treasury bond.  But when including the additional 286 companies whose yield is lower than the 10-year Treasury bond yield, or pay no dividend at all, the average 12-month dividend growth has been just over 14.0%.  During the same time, earnings for the S&P 500 grew by close to 12%.  That means that companies actually grew their dividends modestly faster than their earnings were growing.  Would dead fish companies do that?  Absolutely not.  A company would only hike its dividend at a faster rate than its earnings if it was completely confident that it would not need the money later.

So we have another one of those conundrums here.  The average company in the US is reasonably optimistic about its future.  We would add that the Wall Street analysts agree.  Last Friday, the analysts raised 2012 earnings to new all-time highs.  Thus, at the very time when the speculators were beginning to sling dead fish like there was no tomorrow, the analysts were pushing up 2011 and 2012 earnings. The actions of the analysts are vitally important in solving the conundrum:  It was almost exactly a year ago when the analysts also went against  the fish tossers by continuing to hike earnings for 2010 and 2011 even though stocks were selling off.  We all know now that they were right.  Earnings and dividend increases kept on rolling in and stock prices exploded.

We are not completely discounting the action of the fish tossers.  There certainly is a foul smelling odor coming from Washington these days, and the puny growth of the US economy stinks; but we believe speculators are missing the bigger picture.  World-wide economic growth is projected to be near 3.5% for 2011.  That rather spritely figure includes the smelly slow grow rates in the US and Europe.  The truth is the developing world is still showing solid growth, and, of equal importance, the developing world is a lot bigger than most investors understand.

In previous blogs we have extolled the concept of bond-like stocks.  Our view is for many companies the current dividend payments are very safe; indeed, we believe they will grow at solid rates over the next few years.  Mathematically, a stock yielding 3.7%, with its dividend growing at 7%-8% should clobber the current 2.10% return on a 10-year US Treasury bond.  It is not a guarantee, . . . but perhaps in light of recent events, we might say that questions have been raised about the credit quality of US Treasury bonds, as well.

Wednesday, April 27, 2011

The Dollar's Slide: Terminal or Temporary?

We’ve had a number of clients write or call us lately concerned about the continuing weakness of the U.S. dollar. (It’s down about 10% since December against a basket of currencies.)  Here’s a representative example of their concerns:

“I feel the weak dollar (and growing weaker) is causing us problems and will cause greater problems if the world loses confidence in the US dollar as the world's monetary standard.  Oil is priced in $'s and the dollar's weakened position is costing US and world consumers.  When will the world say enough is enough and then what happens to the US economy?”

There is and old saying among economists that goes: “The solution to high prices is high prices.”  By this they mean that because of the law of supply and demand, higher prices tend to lead to lower demand.  Eventually, this lower demand will cause the sellers of the products to cut prices in order to regain the lost demand.  In this way, higher prices are self-correcting.

The dynamics of currency exchange rates are similar.  To a great extent, the problems tend to correct themselves over time.  As a quick primer, there are five major dynamics that have the most influence over the value of a country’s currency:

Interest Rates:  Holding everything else constant, higher interest rates for a given country relative to its trading partners would cause its currency to strengthen because the high rates would attract buyers.

Inflation:  Higher inflation in a country relative to its trading partners normally weakens its currency.

Balance of Trade: Shifts in a country’s balance of trade exert pressure on its currency.  Growing exports relative to imports strengthen its currency; weakening exports do just the opposite.

Budget Deficits:  Higher budget deficits as a percent of GDP weaken a country’s currency, while lower budget deficits strengthen its currency.

GDP: So long as a country’s inflation rate is muted, the higher the country’s GDP, the stronger will be its currency.

As with most aspects of investing, the expectations of how each of the above factors will behave in the future have as much impact on the value of the currency as their current levels.

This analysis, unfortunately, may produce as many questions as it answers, but such is the nature of discussing currencies.  Someone once said, “When it comes to currencies, everything affects everything.” Having said this, currency fluctuations are a daily concern for us because we own so many foreign based stocks.  Thus, based on our current holdings, we are keeping an eye on the Canadian dollar, the British pound, the Chinese yuan, the Swiss Franc, the Danish krone, and the euro.

Using the above five factors, let us offer a brief analysis of the most likely trend of the U.S. dollar over the next few years. 
  • Short-term interest rates in the U.S. are among the lowest in the world.   However, when the current round of quantitative easing (QE2) ends in June, those rates should rise, at least a little.  Further, the Fed is expected to begin raising the Federal Funds Rate (FFR) – now at 0.0% - 0.25% by year end.  So, both ending QE2 and raising the FFR should lift the US$.
  •  Core inflation in the U.S. is hovering around 1%, very low compared to our trading partners.  Thus, this is favorable for the dollar.  However, if inflation gets too high, the Fed will raise interest rates to fight it.  (Higher interest rates = stronger currency, part of that self-limiting mentioned above.)
  • A cheap dollar makes U.S.-manufactured goods more competitive overseas, helping to boost U.S. exports.  Higher exports improve our balance of trade and GDP and should give a lift to the dollar.  This is a prime example of the self-correcting qualities of a weak dollar.  Ironically, however, a weak dollar means that the cost of imports rise, especially oil.  This puts upward pressure on inflation.  Are you getting the picture of the concept of “everything affects everything?"
  • Budget deficits and high U.S. debt relative to GDP are the big killers right now for the value of the dollar.  Standard and Poors’ (S&P), in its recent change of outlook for US debt from stable to negative, said one of the reasons for the action was their belief that prospects for meaningful deficit reduction in the current political climate were low.  As you remember, the Dow Jones fell over 200 points for the day on that news, and S&P’s action jumped from the financial pages to the dinner table.  In doing so, S&P may have done us all a favor by turning up the heat on Washington to make progress on budget cutting.  S&P’s message was clear: clean up your financial house or face a downgrade of your bonds.  Downgrade or no, deficits will continue to play a role in the direction of the dollar.
  • The United States GDP is the largest in the world, so that helps.   But it is not growing as fast as GDP in the developing countries of China, India, Brazil and other Asian countries.  Indeed, U.S. GDP is growing more slowly than the global average right now, which has somewhat of a weakening influence on the dollar. 
So there you have it. Combining all these factors and comparing them with similar data from our major trading partner nations is producing a negative demand for the US dollar against most other major currencies.

We believe the two primary drivers of the weak dollar are the negative attitudes by some about QE2 and the size and growth rate of the US budget deficit.  As you know, we have been in favor of QE2 because we believe it has provided needed stimulus for the economy and consumer confidence.  We also believe the Federal Reserve has the will and the power to terminate it without disrupting the markets.  Our view has been validated by the rising stock prices over the last six months; unfortunately our optimism has not been shared by the currency traders.  With QE2 coming to an end, it would seem some pressure on the dollar should abate.  

The problem with the budget deficit is too big to solve in the near term.  Indeed, it is exacerbated by the political divide in Washington.  Yet, the problem is too big to ignore any longer.

As we have evaluated the issues surrounding the weakness in the U.S. dollar, in many cases, we believe they are self-limiting or self-correcting.  However, as we said earlier, the biggest problem facing the dollar is the lack of confidence in Washington’s willingness to make the tough decisions to limit the growth of the U.S. debt.  In light of this, pressure on the dollar may continue.

This discussion of the dollar is not simply an answer to a client question.  We deal with currency decisions everyday.  Four years ago we concluded that the dollar was likely to trend lower.  That was even before, the huge increase in government debt.  We redirected our portfolios to benefit from a falling dollar.  At present, more than 60% of the revenues of the companies we own comes from outside the US. Not only are our companies more competitive as a result of the lower dollar, but when their foreign profits are converted back into dollars, they are higher than if they had been produced in the U.S.  Additionally, nearly 20% of our portfolio companies are domiciled outside the US.  With these companies we are benefiting not only from their growing earnings and dividends, but also from the currency translations.  As an example, one of our biggest holdings is Nestle (NSRGY).  A few years ago Nestle’s stock price in Switzerland ended the year flat.  Taking into consideration the currency translations from the falling dollar versus the Swiss franc, NSRGY made a total return of nearly 11%.

Next time we’ll take a swing at the U.S. dollar’s declining importance as the reserve currency of choice.

Written by:  Randy Alsman and Greg Donaldson

Principals and Clients of Donaldson Capital Management own Nestle.

Tuesday, March 22, 2011

So Far Municipal Finances Are Not As Bad As Feared

Analyst Meredith Whitney in December sent the municipal bond world into a hissy fit when she predicted that hundreds of billions of dollars of municipal bonds would default over the next year.  Early on we joined countless municipal experts in disagreeing with Ms. Whitney's prediction.

Governments of all stripes are groaning under their debt loads.  Unfortunately, some politicians seem less intent on balancing their budgets than saving the out-sized fringe benefits of government workers. Yet in spite of some cases of politics a usual, and . . . unusual as in the states of  Wisconsin and Indiana, where runaway legislators shut down the legislative process, progress is being made in almost all corners of the United States in getting costs in line with revenues.

In recent weeks many municipalities across the country have released their 2010 financial reports.  This gives us the opportunity to take a hard look at how our holdings are faring in these tough times.  Thus far almost all the municipalities we have studied have shown improved financial conditions over a year ago.  We own 574 tax-exempt bond issues so we have a ways to go, but there is another important indicator that gives us confidence that things are on the mend.  Of the 574 issues we own, none were downgraded by Standard and Poors or Moodys in the last six months.  Indeed, the ratings changed on only 12 issues and they all rose by at least one rating level.  With tax revenues ticking higher in most states and cost cutting grudgingly underway, we belive we will see a continuation of more rating hikes than cuts during the rest of the year.

We believe even more strongly than we did in December that Ms. Whitney will be wrong in her prediction of massive defaults among municipal bonds.  We now believe unless there are a few anarchists among the legislators of this country -- people who genuinely want municipalities to default -- that the defaults will be few.   

We'll keep you posted as we continue to study our holdings.

Blessings


We own lots of municipal bonds.