 P&G has raised their dividend for 52 consecutive years. P&G has raised their dividend for . . . .
How does a company exist for 52 years, let alone meet the payroll, pay the banks, taxes, and then be able to not only pay a dividend, but raise it for 52 years in a row. P&G has done so by selling modestly priced goods that people use every day and being an innovator in hundreds of products that fill our kitchens, bathrooms, and tummies. There really is no other company like P&G for extending their brands, and adding valuable contributors to their bottom line. They acquired Gillette in 2005 and continued their push into the beauty and personal care business.
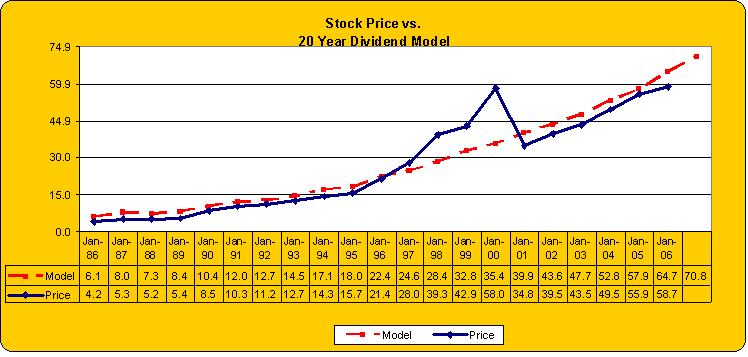
P&G, by any definition is a wonderful company, but is it already priced for perfection? My answer is an emphatic -- NO. I think it is cheap. The chart shows the actual price of P&G (blue line) vs. our dividend valuation model(red line) over the last 20 years. About all you need to get out of the chart is that the red line is higher than the blue line, meaning that P&G is currently selling lower than what our model says is its current valuation.
Our model is estimating that if P&G raises its dividend this year by 10%, that its expected value would be about $71 per share. With the stock currently selling at just under $59, that means it is undervalued by nearly 20%.
The stock yields near 2% and dividends have grown at over 10% per annum for the last 20 years. Remarkable, just remarkable.

Tuesday, January 17, 2006
Procter and Gamble - PG -- Wonderful Company at a Good to Great Price
P&G has raised their dividend for 52 consecutive years. P&G has raised their dividend for . . . .
How does a company exist for 52 years, let alone meet the payroll, pay the banks, taxes, and then be able to not only pay a dividend, but raise it for 52 years in a row. P&G has done so by selling modestly priced goods that people use every day and being an innovator in hundreds of products that fill our kitchens, bathrooms, and tummies. There really is no other company like P&G for extending their brands, and adding valuable contributors to their bottom line. They acquired Gillette in 2005 and continued their push into the beauty and personal care business.
P&G, by any definition is a wonderful company, but is it already priced for perfection? My answer is an emphatic -- NO. I think it is cheap. The chart shows the actual price of P&G (blue line) vs. our dividend valuation model(red line) over the last 20 years. About all you need to get out of the chart is that the red line is higher than the blue line, meaning that P&G is currently selling lower than what our model says is its current valuation.
Our model is estimating that if P&G raises its dividend this year by 10%, that its expected value would be about $71 per share. With the stock currently selling at just under $59, that means it is undervalued by nearly 20%.
The stock yields near 2% and dividends have grown at over 10% per annum for the last 20 years. Remarkable, just remarkable.

Monday, January 09, 2006
Stocks are Very Cheap
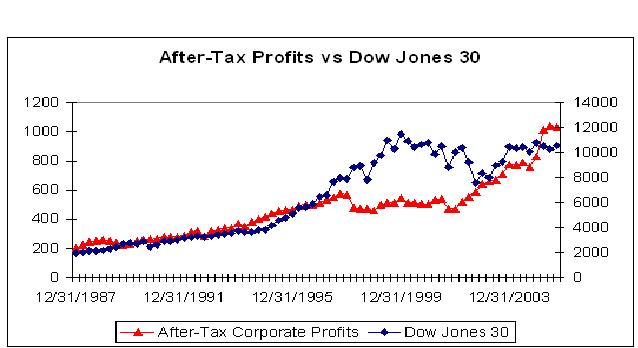
The chart below shows total US after-tax corporate profits versus the price of the Dow Jones Industrial Average since the beginning of 1988. You will notice that the two moved in tandem from 1988 through 1996. At that point, they diverged with the Dow going up and profits going down. Even when you say this out loud, something does not sound right -- stock prices started moving higher while profits were going down? That divergence lasted until 2003, when prices and profits once again converged. I have shown this chart before, and I think it explains a lot about the markets in general and the market today in particular.
The markets are not as efficient as the professors would have us believe. They get over valued and undervalued, and can stay that way for much longer than would seem appropriate. I actually knew about this data in the mid 1990s and convinced myself that the divergence in prices and profits was justified by the fall in inflation and interest rates. I was wrong. As it turns out, the market operates pretty much like we all thought -- it stumbles around, gets lost, zigs when it should be zagging, and yet thank goodness, sometimes, it gets it right. In my judgment, we are entering a period when it will get it right.
The chart shows that after-tax corporate profits have been very strong. Before we go any farther consider that these are the profits corporations are willing to pay taxes on; need I say anything further about their authenticity? Profits have been accelerating and have now moved decisively above the very flat line for stock prices. This is my point: with the expected 8%-10% growth in profits for 2006, the profit line will be equivalent to about 13,000 on the Dow Jones Industrial Average.
More Later,

Monday, January 02, 2006
Darn Good Year for the Economy -----Stocks to Follow
The headlines will report that the Dow Jones was down for the year by .6%. The headlines will not be accurate. Adding in the 2.3% average dividend yield of the DJ 30 for the year, the actual total return was 1.7%. I think most of us would have taken a positive return for the year, if in the first week of 2005, we would have been told that the year would see oil prices at $70, incredible devastation from the hurricanes that shut down parts of the country, inflation reaching 4%, eight rate hikes by the Federal Reserve, and the downgrading of General Motors and Ford to junk bond status.
You won't find much good news about stocks or the economy in the millions of words that will spew forth from the main stream media about 2005. Throw in the slide in the President's ratings and the retirement of Alan Greenspan, and we could have the makings of a outright pity party on the front pages of Time, Newsweek, Business Week, The New York Times, The Washington Post, and The Los Angeles Times. But, as usual, the main stream media does not get it, and because of that, many American's won't either. That is a very distressing reality. In my travels over the Holiday season, I have spoken with many people who parrot the media's pity party, and I am amazed that people can be so well informed of the woes of the economy, so incorrectly.
In my early years in the investment business, I would devour Business Week, Forbes, and The New York Times (Sunday) for the "inside scoop" on the economy and stocks. I know now that what I was reading was at best "an angle" of the truth, and not the real thing. It took me a long time to learn that when it comes to making money "an angle" of the truth is about as worthless as a lie.
The real stories of 2005 were the incredible resiliency and strength of the US economy, the remarkable ability of corporate America to control costs and produce profitable growth, and the pluck of US consumers. Nowhere are you likely to read that US GDP growth was near 4%, almost 25% ABOVE the average annual GDP growth of the last 80 years. Lost in the noise of the flat year for stocks will be the fact that S&P 500 profits likely grew by nearly 13%, and overall US after-tax corporate profits were up near 20%. Dividend growth of near 10% will likely be completely ignored.
Overshadowing worries about outsourcing and layoffs, the US economy produced 2,000,000 new jobs in 2005, as the unemployment rate fell from 5.4% in 2004 to 5.0%. Also ignored will be the single most important statistic on the face of the earth -- almost 70% of US citizens own their own homes, more than at anytime in the history of the world.
The main stream media's biased reporting of politics has been exposed, and they have seen a collapse in their subscribers, as people seeking the truth about political claims have moved on to reliable internet blogs to find the facts. The main stream financial press is next. They are "underreporting" the strength of the US economy. I do not blame the media for the flat performance of stocks, but they are entirely wrong in their supposition that the flat stock market is a sign of a weak economy. The flat stock market, in my judgment, is a psychological phenomenon resulting from the uncertainties of 2005 and a desire to "not fight the fed."
In my judgment, 2006 will be another year of solid economic data. I expect GDP growth to be near 3.5%, which, although above the 80 year average of 3.1%, will allow the Fed to go to the sidelines. A somewhat slower economy will also take some pressure off of energy demand, allowing oil prices to fall modestly. 2006 will be another good year for job growth, albeit somewhat slower than this past year.
There will be surprises in the year ahead; there always are. But the free market economy that the United States possess has proven over and over that it is much more resilient than the main stream media understands. It is a job creating engine, it is a wealth creating engine, and it is an innovation producing engine.
If you stand back far enough to get away from the odor that the mains stream media emits, you might think things are pretty good for the average American. If you have reached a place in your life, where you understand this, it is a very short trip to the notion that a flat stock market does not reflect the value that was produced in the US economy in 2005. I believe the current price of the Dow Jones 30 is at least 15% below its value, and that is not including 2006 earnings and dividend growth. In my mind it is just a matter of time before price and value intersect.
Saturday, December 24, 2005
Merry Christmas
A friend and client forwarded this email to me. It details many elements of the Christmas season and their meanings throughout history.
Merry Christmas to all, and to all goodnight,
http://www.deerlakemail.com/teach/
Monday, December 12, 2005
Valuation, Valuation, Valuation
I get people fussing with me all the time about the merits of dividend investing. These conversations go something like this: "The bottom line to me is the bottom line on my account statement," they say. "Dividends might be real money and be predictable, but they are not what makes a good investment. A good investment is one I buy low and sell high. Price growth and only price growth matters to me." If I hear this once a month, I hear it a dozen times a month. I hear it so often that it makes me think, I might have the privilege of working in this business for a long time because this kind of thinking is shortsighted, ill-informed, and costly.
Here's my bottom line. If you don't know what makes a stock go up, what good is the price rise to you. When do you take the profit--too soon, too late, never? The markets being what they are, the price will in time go down, and you won't understand that either. So you will cycle between "feeling" good when the market goes up and "feeling" bad when it goes down and have absolutely no idea which of your feelings is accurate. Moreover, as it relates to feelings and the stock markets, most likely neither of them is correct. Feelings are not facts in investing; not yours, not mine.
To escape the cycle of feelings and get connected to reality, you must develop some understanding of how to value a company. I have spent 20 years trying to do this, and my research shows that for many large companies the level and growth rate of their dividends is the best indicator of value. If you study the relationships between dividends and stock prices, you will be surprised by two things: 1. dividend trends are very consistent and persistent and much less volatile than prices or earnings; 2. and yet it is clear that prices follow dividends and not the other way around.
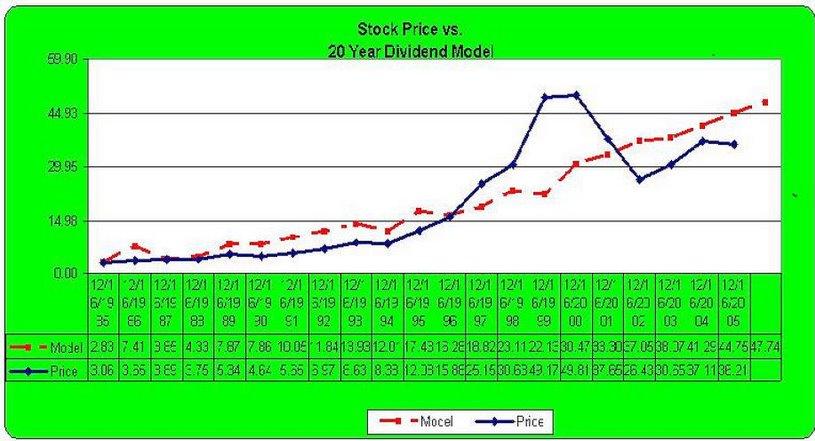
The Dividend Valuation chart below of General Electric is a good example of what I am talking about. The red line is our dividend valuation model for GE over the last 20 years. The Blue line is GE's actual price over this time. Many things are obvious with even a casual glance at the chart: first, the valuation line (red) is virtually a straight line, while the blue line showing price has been all over the road; second, the volatility of price has carried it back and forth across the valuation line; third, buying GE when its price was lower than its valuation line and selling it when its price was above the valuation line has been a near fool proof long-term strategy for the stock. Our rate of return is even better if we buy when price is 10% below valuation and sell when price is 10% above valuation. Finally, the chart shows that the model is signaling that GE is currently selling far below its valuation line, which would suggest it is a good buy. In fact the model is showing that GE is selling nearly 25% below its valuation line. Understanding the model as I do, the only way that the price of GE will now close the 25% gap is if its dividend growth slows dramatically or interest rates sky rocket, neither of which I believe is a strong possibility.
Investing always involves risk, but determining the value of a company keeps you from making emotional decisions that have little chance of success. But of even more importance is understanding value keeps you from getting shaken out of a cheap stock just because the price is going against you.
Someone is always trying to tell me I should be buying this stock or that one. When I ask why, the answer is almost always the same: "Because it's going up." Looking at the chart below, there were a lot of people who were touting GE in 1999, who are still underwater. But there is good news. By my calcuation, they will be back to break even in 2007.
-------GE Dividend Valuation Chart-------
Friday, December 02, 2005
UTX -- Of Horses and Hoods
I'm going to provide a look under the hood of one of our stock valuation models using United Technologies (UTX) as an example. Since 1988 the combination of UTX's dividend growth and the change in interest rates on a 10 Year US T-bond have explained 92% of the annual price movement of the stock. That model currently estimates that the current fair price range should be between $60 and $70 per share, with $65 being the midpoint of the range. UTX is now selling for $55 per share.
At today's price that puts UTX at as great a discount from expected value as at anytime in the last decade. But does that mean it is a table-pounding buy? Yes and no. The expected price range is well above UTX's current selling price, but a look at UTX's history shows that it has had periods of under and over valuation lasting up to 3 years. I fully expect UTX will reach $65 per share over the next few years, thus the question in my mind is not if, but when.
If UTX reaches $65 in the next year, it will produce a total return of approximately 18%; if it takes two years, we will make a little less than 9%. The reason I believe the odds favor UTX reaching $65 sooner rather than later is because UTX has already been undervalued for the past 12 months, so the averages are in our favor.
I just spoke to the company last week and tried to pry out of them what their dividend hike in 2006 might look like. They were noncommittal, except to say a dividend hike was likely in the first quarter. I told them they had enough free cash flow to choke a horse, and I thought their shareholders would applaud, another big dividend hike and a public statement about future hikes.
The company representative with whom I spoke was so used to talking with Wall Street analysts, who completely ignore dividends, that he seems a bit startled when I told him I would rather have the dividend hike than share buy backs.
I mentioned that I had read where the company was disappointed that its stellar 2005 results had largely been ignored by the market, I suggested that a commitment to a dividend payout ratio of 35% would do wonders for the stock price. He was a very pleasant man and said he would pass on my suggestion.
Let's put this one on our radar and see what the next dividend hike looks like. UTX is in our Rising Income Portfolio. Illinois Tool Works, which has a very similar story, is in our Blue Chip Growth Portfolio. I'll review it next.
Wednesday, November 30, 2005
The Evansville Client Dinner -- It was a Blast
Donaldson Capital held its annual client appreciation dinner in Evansville last night. The event was held at the Evansville Museum of Arts and Science. We ate a wonderful meal surrounded by beautiful art and artifacts. Everything went great except for our Texas friends hanging their coats on a piece of contemporary art, which they mistook for a coat rack.
Mike Hull offered our thank yous to clients old and new and shared a bit of our strategy for the future. I cut my speech in half at the request of some of the oldtimers, who said the wine, hors d'ouevres, and conversation were more fun than speech making. I have to agree, but I still got my 8 charts on the wall which showed some of the research that we have conducted on dividends and their correlations to prices.
It was a great night, and the only person I saw nod off was JWB (he's heard it all before). For those of you who were there, that is the reason I had to pick on him a little. He's promised to get his beauty rest next year.
Blessings to all of you. You are our only reason to be. You humble us with your kindness and your trust. We are deeply honored to serve you.
As I said earlier, we will be having other dinners in cities where we work in the months ahead.
Subscribe to:
Posts (Atom)