
Monday, December 12, 2005
Valuation, Valuation, Valuation
I get people fussing with me all the time about the merits of dividend investing. These conversations go something like this: "The bottom line to me is the bottom line on my account statement," they say. "Dividends might be real money and be predictable, but they are not what makes a good investment. A good investment is one I buy low and sell high. Price growth and only price growth matters to me." If I hear this once a month, I hear it a dozen times a month. I hear it so often that it makes me think, I might have the privilege of working in this business for a long time because this kind of thinking is shortsighted, ill-informed, and costly.
Here's my bottom line. If you don't know what makes a stock go up, what good is the price rise to you. When do you take the profit--too soon, too late, never? The markets being what they are, the price will in time go down, and you won't understand that either. So you will cycle between "feeling" good when the market goes up and "feeling" bad when it goes down and have absolutely no idea which of your feelings is accurate. Moreover, as it relates to feelings and the stock markets, most likely neither of them is correct. Feelings are not facts in investing; not yours, not mine.
To escape the cycle of feelings and get connected to reality, you must develop some understanding of how to value a company. I have spent 20 years trying to do this, and my research shows that for many large companies the level and growth rate of their dividends is the best indicator of value. If you study the relationships between dividends and stock prices, you will be surprised by two things: 1. dividend trends are very consistent and persistent and much less volatile than prices or earnings; 2. and yet it is clear that prices follow dividends and not the other way around.
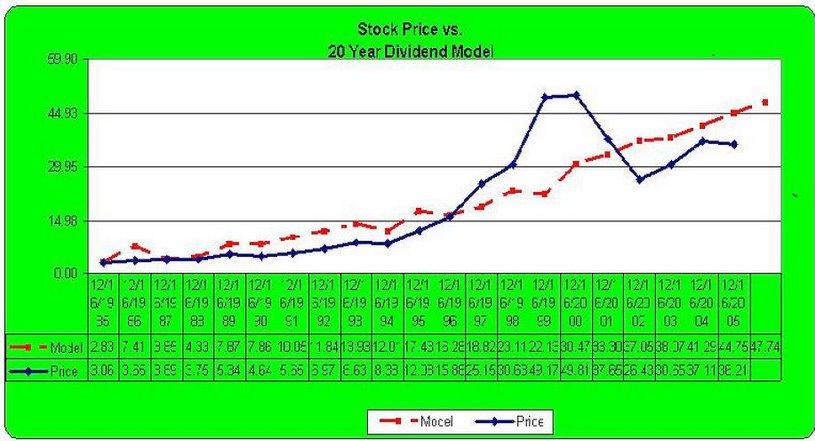
The Dividend Valuation chart below of General Electric is a good example of what I am talking about. The red line is our dividend valuation model for GE over the last 20 years. The Blue line is GE's actual price over this time. Many things are obvious with even a casual glance at the chart: first, the valuation line (red) is virtually a straight line, while the blue line showing price has been all over the road; second, the volatility of price has carried it back and forth across the valuation line; third, buying GE when its price was lower than its valuation line and selling it when its price was above the valuation line has been a near fool proof long-term strategy for the stock. Our rate of return is even better if we buy when price is 10% below valuation and sell when price is 10% above valuation. Finally, the chart shows that the model is signaling that GE is currently selling far below its valuation line, which would suggest it is a good buy. In fact the model is showing that GE is selling nearly 25% below its valuation line. Understanding the model as I do, the only way that the price of GE will now close the 25% gap is if its dividend growth slows dramatically or interest rates sky rocket, neither of which I believe is a strong possibility.
Investing always involves risk, but determining the value of a company keeps you from making emotional decisions that have little chance of success. But of even more importance is understanding value keeps you from getting shaken out of a cheap stock just because the price is going against you.
Someone is always trying to tell me I should be buying this stock or that one. When I ask why, the answer is almost always the same: "Because it's going up." Looking at the chart below, there were a lot of people who were touting GE in 1999, who are still underwater. But there is good news. By my calcuation, they will be back to break even in 2007.
-------GE Dividend Valuation Chart-------