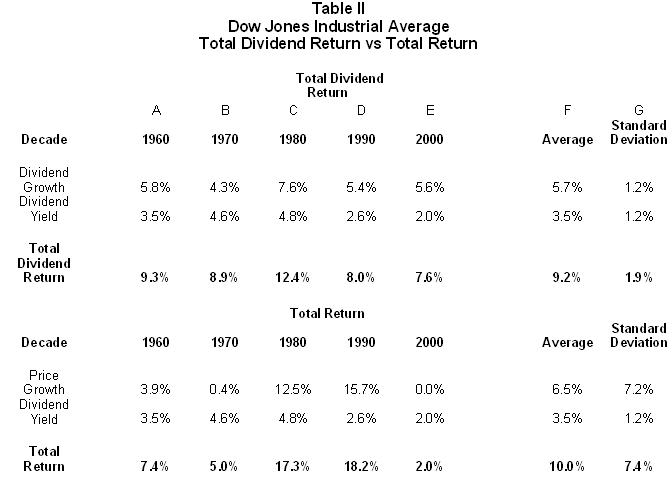
 Table II has a lot going on, so let us describe the major points we will be discussing. The table shows the rates of returns for prices and dividends and the variability of the returns over the last five decades of the Dow Jones Industrial Average. The table compares the well-known concept of investment total return with our less well known “Total Dividend Return.” Our purpose in showing this table is to complete our discussion of a point we brought up earlier about dividends. We said the following:
“Importantly, our research shows that in the case of the DJIA, the steadily rising dividends have not only increased the investment returns they have also provided an important indication of the valuation of the DJIA itself. . . .”
At Donaldson Capital Management, we often say that many of our companies’ dividends are consistent and persistent. Just how consistent they are may surprise you. Earlier we said that the cumulative dividends of the DJIA have risen about 8 out every 10 years. The upper half of Table II shows dividend growth and dividend yield over the last five decades. Column A shows in the 1960s dividends grew by an average of 5.8% per year. Column F reveals that the average dividend growth for the last five decades has been 5.7%. The chart vividly shows that dividend growth has been very consistent during this time, with only the 7.6% growth in 1980s diverging very far from the growth of the other decades. We investigated this divergence and found that it was driven by the large dividend increases that companies made in 1987 and 1988. This was in the aftermath of the stock market crash in 1987, and we believe the outsized increases were the DJIA companies’ attempt to reassure their shareholders. We believe this precedent has big ramifications for today, which we will address shortly.
For the last five decades the standard deviation (average volatility) of dividend growth (Column G) has been only 1.2%. Statistically, dividend growth by decade has been remarkably stable.
Dividend yield by decade is in the row just under dividend growth. The average dividend yield for the five decades is shown in column G as 3.5%. Total return is defined as price appreciation plus dividend yield. In our “Total Dividend Return,” we substitute dividend growth for price appreciation. Thus, “Total Dividend Return” is equal to dividend growth plus dividend yield.
Total Dividend Return by decade for the DJIA has ranged from a low of 7.5% for the first half of the current decade, to a high of 12.3% for the decade of the 1980s. The five-decade average for DJIA Total Dividend Return has been 9.2% (Column F), again with a miniscule standard deviation of 1.9%.
Our theory holds that in the long-run, the total return of a stock should be approximately equal to its dividend yield plus its dividend growth, or as we have explained here, its Total Dividend Return. The reason is simple. If a company is giving its shareholders their fair cut of the profits, it should show up in the stock price. The stock market is a pricing machine. The more transparent a company is with their dividend policy, the more accurately the market will price their stock.
The average Total Dividend Return of 9.2% over the last five decades should sound very familiar. If it does not, the bottom half of Table 3 will refresh your memory. For the last five decades, the Dow Jones Industrial Average has averaged an annual total return of 10%, as shown in Column F. This has consisted of 6.5% average price growth and 3.5% average dividend yield (Column F).
It is eye opening that Total Dividend Return and total return in the DJIA have been so similar. Investors could have ignored the news of recessions, wars, oil shocks, assassinations, and tech bubbles. They could have dropped their subscriptions to the Wall Street Journal and pulled the plug on the talking heads on CNBC. They could have breathed easier each time a crisis of any kind came along; indeed, they could have dramatically reduced the time they invested in keeping up with the Dow Joneses. Instead, they could have watched just two things, the dividend growth and the dividend yield of the DJIA, and achieved over 90% of the rate of return of the index. But of equal importance, they could have done so with 75% less volatility than with the DJIA itself. The standard deviation of the Total Dividend Return as shown in Column F has been only 1.9% on an average return of 9.2%. This is in sharp contrast to the 7.4% standard deviation of the DJIA on its 10% average annual return.
We believe viewing the stock market or an individual stock from a dividend perspective is the right approach for most people. Dividends not only contribute directly to investment returns because they are real money, but they also have predictive powers for stock price appreciation, as well.
Table II has a lot going on, so let us describe the major points we will be discussing. The table shows the rates of returns for prices and dividends and the variability of the returns over the last five decades of the Dow Jones Industrial Average. The table compares the well-known concept of investment total return with our less well known “Total Dividend Return.” Our purpose in showing this table is to complete our discussion of a point we brought up earlier about dividends. We said the following:
“Importantly, our research shows that in the case of the DJIA, the steadily rising dividends have not only increased the investment returns they have also provided an important indication of the valuation of the DJIA itself. . . .”
At Donaldson Capital Management, we often say that many of our companies’ dividends are consistent and persistent. Just how consistent they are may surprise you. Earlier we said that the cumulative dividends of the DJIA have risen about 8 out every 10 years. The upper half of Table II shows dividend growth and dividend yield over the last five decades. Column A shows in the 1960s dividends grew by an average of 5.8% per year. Column F reveals that the average dividend growth for the last five decades has been 5.7%. The chart vividly shows that dividend growth has been very consistent during this time, with only the 7.6% growth in 1980s diverging very far from the growth of the other decades. We investigated this divergence and found that it was driven by the large dividend increases that companies made in 1987 and 1988. This was in the aftermath of the stock market crash in 1987, and we believe the outsized increases were the DJIA companies’ attempt to reassure their shareholders. We believe this precedent has big ramifications for today, which we will address shortly.
For the last five decades the standard deviation (average volatility) of dividend growth (Column G) has been only 1.2%. Statistically, dividend growth by decade has been remarkably stable.
Dividend yield by decade is in the row just under dividend growth. The average dividend yield for the five decades is shown in column G as 3.5%. Total return is defined as price appreciation plus dividend yield. In our “Total Dividend Return,” we substitute dividend growth for price appreciation. Thus, “Total Dividend Return” is equal to dividend growth plus dividend yield.
Total Dividend Return by decade for the DJIA has ranged from a low of 7.5% for the first half of the current decade, to a high of 12.3% for the decade of the 1980s. The five-decade average for DJIA Total Dividend Return has been 9.2% (Column F), again with a miniscule standard deviation of 1.9%.
Our theory holds that in the long-run, the total return of a stock should be approximately equal to its dividend yield plus its dividend growth, or as we have explained here, its Total Dividend Return. The reason is simple. If a company is giving its shareholders their fair cut of the profits, it should show up in the stock price. The stock market is a pricing machine. The more transparent a company is with their dividend policy, the more accurately the market will price their stock.
The average Total Dividend Return of 9.2% over the last five decades should sound very familiar. If it does not, the bottom half of Table 3 will refresh your memory. For the last five decades, the Dow Jones Industrial Average has averaged an annual total return of 10%, as shown in Column F. This has consisted of 6.5% average price growth and 3.5% average dividend yield (Column F).
It is eye opening that Total Dividend Return and total return in the DJIA have been so similar. Investors could have ignored the news of recessions, wars, oil shocks, assassinations, and tech bubbles. They could have dropped their subscriptions to the Wall Street Journal and pulled the plug on the talking heads on CNBC. They could have breathed easier each time a crisis of any kind came along; indeed, they could have dramatically reduced the time they invested in keeping up with the Dow Joneses. Instead, they could have watched just two things, the dividend growth and the dividend yield of the DJIA, and achieved over 90% of the rate of return of the index. But of equal importance, they could have done so with 75% less volatility than with the DJIA itself. The standard deviation of the Total Dividend Return as shown in Column F has been only 1.9% on an average return of 9.2%. This is in sharp contrast to the 7.4% standard deviation of the DJIA on its 10% average annual return.
We believe viewing the stock market or an individual stock from a dividend perspective is the right approach for most people. Dividends not only contribute directly to investment returns because they are real money, but they also have predictive powers for stock price appreciation, as well.

Thursday, March 16, 2006
In the Long run, Price Follow Dividends -- Part II
Aside from describing the market’s apparent mispricing of BAC, our discussion of Donaldson Capital Management’s Yield to Cost methodology has spent very little time addressing stock prices. We have been saying for a long time that people agonize over current prices much more than they should. The average difference between the high and low of an individual stock in a typical year is nearly 30%. This is just the nature of the beast, stocks go up and down. Sometimes there is a good reason; most times they just go up and down because speculators are hurling stocks back and forth among themselves for reasons known only to them. But, as we mentioned earlier, dividends are remarkably stable and consistent, and in the long-term they are highly correlated to stock prices. Table II below is an eyeful and has profound consequences for investors of all ages. We believe that it shows that there is another way of investing that is less volatile, more predictable, and yet, offers similar rates of return as does a capital growth oriented style of investment strategy. Please study this table. In our judgment, it does more to de-mystify investing than anything we have ever written.
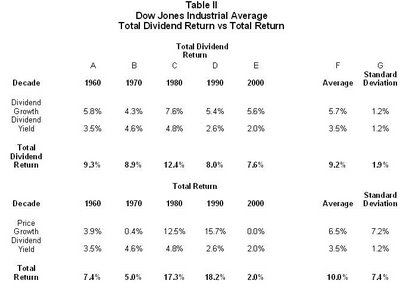 Table II has a lot going on, so let us describe the major points we will be discussing. The table shows the rates of returns for prices and dividends and the variability of the returns over the last five decades of the Dow Jones Industrial Average. The table compares the well-known concept of investment total return with our less well known “Total Dividend Return.” Our purpose in showing this table is to complete our discussion of a point we brought up earlier about dividends. We said the following:
“Importantly, our research shows that in the case of the DJIA, the steadily rising dividends have not only increased the investment returns they have also provided an important indication of the valuation of the DJIA itself. . . .”
At Donaldson Capital Management, we often say that many of our companies’ dividends are consistent and persistent. Just how consistent they are may surprise you. Earlier we said that the cumulative dividends of the DJIA have risen about 8 out every 10 years. The upper half of Table II shows dividend growth and dividend yield over the last five decades. Column A shows in the 1960s dividends grew by an average of 5.8% per year. Column F reveals that the average dividend growth for the last five decades has been 5.7%. The chart vividly shows that dividend growth has been very consistent during this time, with only the 7.6% growth in 1980s diverging very far from the growth of the other decades. We investigated this divergence and found that it was driven by the large dividend increases that companies made in 1987 and 1988. This was in the aftermath of the stock market crash in 1987, and we believe the outsized increases were the DJIA companies’ attempt to reassure their shareholders. We believe this precedent has big ramifications for today, which we will address shortly.
For the last five decades the standard deviation (average volatility) of dividend growth (Column G) has been only 1.2%. Statistically, dividend growth by decade has been remarkably stable.
Dividend yield by decade is in the row just under dividend growth. The average dividend yield for the five decades is shown in column G as 3.5%. Total return is defined as price appreciation plus dividend yield. In our “Total Dividend Return,” we substitute dividend growth for price appreciation. Thus, “Total Dividend Return” is equal to dividend growth plus dividend yield.
Total Dividend Return by decade for the DJIA has ranged from a low of 7.5% for the first half of the current decade, to a high of 12.3% for the decade of the 1980s. The five-decade average for DJIA Total Dividend Return has been 9.2% (Column F), again with a miniscule standard deviation of 1.9%.
Our theory holds that in the long-run, the total return of a stock should be approximately equal to its dividend yield plus its dividend growth, or as we have explained here, its Total Dividend Return. The reason is simple. If a company is giving its shareholders their fair cut of the profits, it should show up in the stock price. The stock market is a pricing machine. The more transparent a company is with their dividend policy, the more accurately the market will price their stock.
The average Total Dividend Return of 9.2% over the last five decades should sound very familiar. If it does not, the bottom half of Table 3 will refresh your memory. For the last five decades, the Dow Jones Industrial Average has averaged an annual total return of 10%, as shown in Column F. This has consisted of 6.5% average price growth and 3.5% average dividend yield (Column F).
It is eye opening that Total Dividend Return and total return in the DJIA have been so similar. Investors could have ignored the news of recessions, wars, oil shocks, assassinations, and tech bubbles. They could have dropped their subscriptions to the Wall Street Journal and pulled the plug on the talking heads on CNBC. They could have breathed easier each time a crisis of any kind came along; indeed, they could have dramatically reduced the time they invested in keeping up with the Dow Joneses. Instead, they could have watched just two things, the dividend growth and the dividend yield of the DJIA, and achieved over 90% of the rate of return of the index. But of equal importance, they could have done so with 75% less volatility than with the DJIA itself. The standard deviation of the Total Dividend Return as shown in Column F has been only 1.9% on an average return of 9.2%. This is in sharp contrast to the 7.4% standard deviation of the DJIA on its 10% average annual return.
We believe viewing the stock market or an individual stock from a dividend perspective is the right approach for most people. Dividends not only contribute directly to investment returns because they are real money, but they also have predictive powers for stock price appreciation, as well.
Table II has a lot going on, so let us describe the major points we will be discussing. The table shows the rates of returns for prices and dividends and the variability of the returns over the last five decades of the Dow Jones Industrial Average. The table compares the well-known concept of investment total return with our less well known “Total Dividend Return.” Our purpose in showing this table is to complete our discussion of a point we brought up earlier about dividends. We said the following:
“Importantly, our research shows that in the case of the DJIA, the steadily rising dividends have not only increased the investment returns they have also provided an important indication of the valuation of the DJIA itself. . . .”
At Donaldson Capital Management, we often say that many of our companies’ dividends are consistent and persistent. Just how consistent they are may surprise you. Earlier we said that the cumulative dividends of the DJIA have risen about 8 out every 10 years. The upper half of Table II shows dividend growth and dividend yield over the last five decades. Column A shows in the 1960s dividends grew by an average of 5.8% per year. Column F reveals that the average dividend growth for the last five decades has been 5.7%. The chart vividly shows that dividend growth has been very consistent during this time, with only the 7.6% growth in 1980s diverging very far from the growth of the other decades. We investigated this divergence and found that it was driven by the large dividend increases that companies made in 1987 and 1988. This was in the aftermath of the stock market crash in 1987, and we believe the outsized increases were the DJIA companies’ attempt to reassure their shareholders. We believe this precedent has big ramifications for today, which we will address shortly.
For the last five decades the standard deviation (average volatility) of dividend growth (Column G) has been only 1.2%. Statistically, dividend growth by decade has been remarkably stable.
Dividend yield by decade is in the row just under dividend growth. The average dividend yield for the five decades is shown in column G as 3.5%. Total return is defined as price appreciation plus dividend yield. In our “Total Dividend Return,” we substitute dividend growth for price appreciation. Thus, “Total Dividend Return” is equal to dividend growth plus dividend yield.
Total Dividend Return by decade for the DJIA has ranged from a low of 7.5% for the first half of the current decade, to a high of 12.3% for the decade of the 1980s. The five-decade average for DJIA Total Dividend Return has been 9.2% (Column F), again with a miniscule standard deviation of 1.9%.
Our theory holds that in the long-run, the total return of a stock should be approximately equal to its dividend yield plus its dividend growth, or as we have explained here, its Total Dividend Return. The reason is simple. If a company is giving its shareholders their fair cut of the profits, it should show up in the stock price. The stock market is a pricing machine. The more transparent a company is with their dividend policy, the more accurately the market will price their stock.
The average Total Dividend Return of 9.2% over the last five decades should sound very familiar. If it does not, the bottom half of Table 3 will refresh your memory. For the last five decades, the Dow Jones Industrial Average has averaged an annual total return of 10%, as shown in Column F. This has consisted of 6.5% average price growth and 3.5% average dividend yield (Column F).
It is eye opening that Total Dividend Return and total return in the DJIA have been so similar. Investors could have ignored the news of recessions, wars, oil shocks, assassinations, and tech bubbles. They could have dropped their subscriptions to the Wall Street Journal and pulled the plug on the talking heads on CNBC. They could have breathed easier each time a crisis of any kind came along; indeed, they could have dramatically reduced the time they invested in keeping up with the Dow Joneses. Instead, they could have watched just two things, the dividend growth and the dividend yield of the DJIA, and achieved over 90% of the rate of return of the index. But of equal importance, they could have done so with 75% less volatility than with the DJIA itself. The standard deviation of the Total Dividend Return as shown in Column F has been only 1.9% on an average return of 9.2%. This is in sharp contrast to the 7.4% standard deviation of the DJIA on its 10% average annual return.
We believe viewing the stock market or an individual stock from a dividend perspective is the right approach for most people. Dividends not only contribute directly to investment returns because they are real money, but they also have predictive powers for stock price appreciation, as well.
Table II has a lot going on, so let us describe the major points we will be discussing. The table shows the rates of returns for prices and dividends and the variability of the returns over the last five decades of the Dow Jones Industrial Average. The table compares the well-known concept of investment total return with our less well known “Total Dividend Return.” Our purpose in showing this table is to complete our discussion of a point we brought up earlier about dividends. We said the following:
“Importantly, our research shows that in the case of the DJIA, the steadily rising dividends have not only increased the investment returns they have also provided an important indication of the valuation of the DJIA itself. . . .”
At Donaldson Capital Management, we often say that many of our companies’ dividends are consistent and persistent. Just how consistent they are may surprise you. Earlier we said that the cumulative dividends of the DJIA have risen about 8 out every 10 years. The upper half of Table II shows dividend growth and dividend yield over the last five decades. Column A shows in the 1960s dividends grew by an average of 5.8% per year. Column F reveals that the average dividend growth for the last five decades has been 5.7%. The chart vividly shows that dividend growth has been very consistent during this time, with only the 7.6% growth in 1980s diverging very far from the growth of the other decades. We investigated this divergence and found that it was driven by the large dividend increases that companies made in 1987 and 1988. This was in the aftermath of the stock market crash in 1987, and we believe the outsized increases were the DJIA companies’ attempt to reassure their shareholders. We believe this precedent has big ramifications for today, which we will address shortly.
For the last five decades the standard deviation (average volatility) of dividend growth (Column G) has been only 1.2%. Statistically, dividend growth by decade has been remarkably stable.
Dividend yield by decade is in the row just under dividend growth. The average dividend yield for the five decades is shown in column G as 3.5%. Total return is defined as price appreciation plus dividend yield. In our “Total Dividend Return,” we substitute dividend growth for price appreciation. Thus, “Total Dividend Return” is equal to dividend growth plus dividend yield.
Total Dividend Return by decade for the DJIA has ranged from a low of 7.5% for the first half of the current decade, to a high of 12.3% for the decade of the 1980s. The five-decade average for DJIA Total Dividend Return has been 9.2% (Column F), again with a miniscule standard deviation of 1.9%.
Our theory holds that in the long-run, the total return of a stock should be approximately equal to its dividend yield plus its dividend growth, or as we have explained here, its Total Dividend Return. The reason is simple. If a company is giving its shareholders their fair cut of the profits, it should show up in the stock price. The stock market is a pricing machine. The more transparent a company is with their dividend policy, the more accurately the market will price their stock.
The average Total Dividend Return of 9.2% over the last five decades should sound very familiar. If it does not, the bottom half of Table 3 will refresh your memory. For the last five decades, the Dow Jones Industrial Average has averaged an annual total return of 10%, as shown in Column F. This has consisted of 6.5% average price growth and 3.5% average dividend yield (Column F).
It is eye opening that Total Dividend Return and total return in the DJIA have been so similar. Investors could have ignored the news of recessions, wars, oil shocks, assassinations, and tech bubbles. They could have dropped their subscriptions to the Wall Street Journal and pulled the plug on the talking heads on CNBC. They could have breathed easier each time a crisis of any kind came along; indeed, they could have dramatically reduced the time they invested in keeping up with the Dow Joneses. Instead, they could have watched just two things, the dividend growth and the dividend yield of the DJIA, and achieved over 90% of the rate of return of the index. But of equal importance, they could have done so with 75% less volatility than with the DJIA itself. The standard deviation of the Total Dividend Return as shown in Column F has been only 1.9% on an average return of 9.2%. This is in sharp contrast to the 7.4% standard deviation of the DJIA on its 10% average annual return.
We believe viewing the stock market or an individual stock from a dividend perspective is the right approach for most people. Dividends not only contribute directly to investment returns because they are real money, but they also have predictive powers for stock price appreciation, as well.

Tuesday, March 07, 2006
Donaldson Capital's General Dividend Strategy: Part I
Rising dividends have power. But, their power is largely hidden because most people don't know where to look for it. Understood properly, the hidden qualities of rising dividends can afford investors an unobstructed view beyond today's fluctuating prices into the underlying values of an individual stock and the overall market. In this letter, we will identify some of these hidden qualities and how we use them for investment analysis and selection. Dividends are becoming a more familiar subject among investors, but judging from the articles we have read in the mainstream media, the public is still primarily interested in high dividend yield, with dividend growth running a distant second. It is natural that high dividend yield investing would get the most attention. It is easy to understand. The formula for current dividend yield is very straight forward:
 For example, Bank of America (BAC) pays a dividend of $2.00 and is selling at $45.00 per share, producing a current dividend yield of 4.44%. Although a yield of 4.44% is attractive, particularly in a world where a 10-year US Treasury Bond yields just over 4.0%, our research shows conclusively that it is the combination of dividend yield and dividend growth that offers the greatest rewards. BAC is one of our favorite stocks, but we like it for important reasons beyond its current dividend yield. Indeed, if its current dividend yield were all we could expect over the next 10 years, we would buy the Treasury bond because it is backed by the full faith and credit of the US government, while BAC's dividend is not guaranteed and could be cut to zero next week without violating any laws.
Quality Door
It is important to remember that dividends are not a legal obligation; they are paid at the sole discretion of the board of directors of the company. That is why, even though we invest only in stocks that pay dividends, our investment selection process does not start by going through the "Dividend Door." That process starts through the "Quality Door." By this we mean that all of our potential portfolio holdings must possess solid creditworthiness before we will even look at them from a dividend perspective. Indeed, the first question we ask about companies we are considering is -- would we loan them money? We expect to own most of the companies we buy for many years. Over time, some sort of bad news inevitably hits all companies. We want to be sure that the companies we own can take these hits and continue on without coming apart. The idea that you can jump in and out of stocks and avoid the hits is widespread among investors today and is simply not true. We can cite countless examples of where bad news has hit a company without warning, severely testing the financial and management resources of the organization for years, and never giving traders a prayer of getting their money back.
Most high-yield dividend stocks we see touted in the media can not pass through the quality door test. We think they are an accident waiting to happen. The companies are using high dividends just to keep investors happy, but they are, essentially, liquidating their companies by paying out more than they can afford. When the inevitable bad news comes, their high dividend will be the first thing to go.
If we were to reduce our investment selection process to one sentence it would be:
We seek to own companies with unquestioned financial strength that pay a generous dividend and promise superior dividend growth in the future.
The word dividend comes from the French word, dividere, meaning, to cut. Dividends are literally your "cut" of the company's profits, and herein lies the first hidden value of rising dividend investing: In selected companies, dividends go up almost every year. Indeed, in the last 45 years, the cumulative dividends of the Dow Jones Industrial Average (DJIA) have risen 37 times and fallen only 8 times. Few people are aware just how stable the dividends of some major companies really are. Another hidden value is that for the DJIA, the steadily rising dividends have not only represented nearly 40% of the DJIA's total investment return, they have also provided an important gauge for determining the value of the DJIA itself. We will elaborate on this idea later.
Yield at Cost
The current dividend yield of a stock whose dividend is stable is easily understood. You do not even need to know the formula because it is computed for you and shown in most financial publications for every stock. When you look at BAC in the paper or at an online financial site, it will look something like this:
For example, Bank of America (BAC) pays a dividend of $2.00 and is selling at $45.00 per share, producing a current dividend yield of 4.44%. Although a yield of 4.44% is attractive, particularly in a world where a 10-year US Treasury Bond yields just over 4.0%, our research shows conclusively that it is the combination of dividend yield and dividend growth that offers the greatest rewards. BAC is one of our favorite stocks, but we like it for important reasons beyond its current dividend yield. Indeed, if its current dividend yield were all we could expect over the next 10 years, we would buy the Treasury bond because it is backed by the full faith and credit of the US government, while BAC's dividend is not guaranteed and could be cut to zero next week without violating any laws.
Quality Door
It is important to remember that dividends are not a legal obligation; they are paid at the sole discretion of the board of directors of the company. That is why, even though we invest only in stocks that pay dividends, our investment selection process does not start by going through the "Dividend Door." That process starts through the "Quality Door." By this we mean that all of our potential portfolio holdings must possess solid creditworthiness before we will even look at them from a dividend perspective. Indeed, the first question we ask about companies we are considering is -- would we loan them money? We expect to own most of the companies we buy for many years. Over time, some sort of bad news inevitably hits all companies. We want to be sure that the companies we own can take these hits and continue on without coming apart. The idea that you can jump in and out of stocks and avoid the hits is widespread among investors today and is simply not true. We can cite countless examples of where bad news has hit a company without warning, severely testing the financial and management resources of the organization for years, and never giving traders a prayer of getting their money back.
Most high-yield dividend stocks we see touted in the media can not pass through the quality door test. We think they are an accident waiting to happen. The companies are using high dividends just to keep investors happy, but they are, essentially, liquidating their companies by paying out more than they can afford. When the inevitable bad news comes, their high dividend will be the first thing to go.
If we were to reduce our investment selection process to one sentence it would be:
We seek to own companies with unquestioned financial strength that pay a generous dividend and promise superior dividend growth in the future.
The word dividend comes from the French word, dividere, meaning, to cut. Dividends are literally your "cut" of the company's profits, and herein lies the first hidden value of rising dividend investing: In selected companies, dividends go up almost every year. Indeed, in the last 45 years, the cumulative dividends of the Dow Jones Industrial Average (DJIA) have risen 37 times and fallen only 8 times. Few people are aware just how stable the dividends of some major companies really are. Another hidden value is that for the DJIA, the steadily rising dividends have not only represented nearly 40% of the DJIA's total investment return, they have also provided an important gauge for determining the value of the DJIA itself. We will elaborate on this idea later.
Yield at Cost
The current dividend yield of a stock whose dividend is stable is easily understood. You do not even need to know the formula because it is computed for you and shown in most financial publications for every stock. When you look at BAC in the paper or at an online financial site, it will look something like this:
Name>>>Price>>> High>>> Low>>> Volume>>> PE>>> Dividend Yield BAC >>>>45 >>>>46.25>>> 44.15>>> 300,000 >12>>>> 2.00>>> 4.4
But, understanding the value of a rising dividend is much tougher and techniques to assist you in doing so are almost totally absent in today's media. One approach we use to uncover this hidden value is the concept of "Yield at Cost." Yield at Cost is the current dividend divided by your original purchase price. Yield at Cost is quite revealing once you understand how to use it. Let us show a Yield at Cost analysis for BAC. Most investors look only at price. Some might look at PE or yield, but almost no one will look at the most important data on the line, dividend. Let's say you bought BAC ten years ago. Table 1 on the next page shows that in 1995 you would have paid $14.53 per share for BAC. Dividing the current dividend of $2.00 by your original purchase price, we find that your Yield at Cost is 13.77%. This is a remarkable cash on cash return, yet no financial publication in the world can show it to you, because it is yours and yours alone. Looking at Table 1, you will see that in 1995 BAC paid a dividend of $.52, which produced a dividend yield of 3.58%. Over the last 10 years, however, the company has raised its dividend every year and today pays $2.00, almost four times what it paid in 1995. Please note that BAC's current yield, as would have been reported in the media, ranged between 2.25% and 4.44% (Column F). Your Yield at Cost, which Column G shows was rising every year, would have been completely hidden from you, unless you understood the concept. Let's look at Table 1 to see other important features of dividend investing.
Please double click the table to enlarge it.
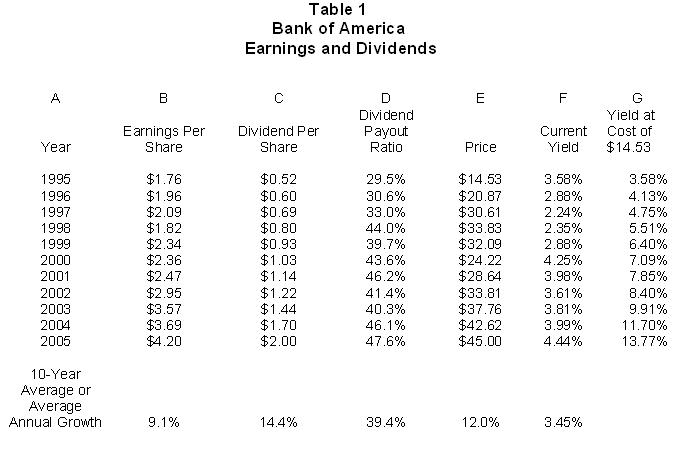 If you are like most people, who look only at price, you wake up every morning saying, "Should I sell my BAC and take my profit, or should I wait for another day when it might be higher?" Our guess is that most price-only investors who bought BAC in 1995 had a very tough time holding the stock in the late 1990s. The stock went flat from 1997 through 2002 (Column E), at a time when the investment world became inebriated with tech stocks. Yet, even though BAC's price was going nowhere, its dividend and underlying value were increasing by double digits every year. BAC's dividend went from $.69 in 1997 to a $1.22 in 2002. That is nearly an 80% increase in cash distributions and the price hardly moved. That alone should have been a warning that something was amiss with the market's valuation mechanism. In hindsight, it is now clear that during this time something other than valuation was driving stock prices. That something was the irrational exhuberance for the thin air of high flying techs. Understanding that your Yield at Cost was rising every year, may have given you enough incentive not to go chasing tech stocks that were trading at 200 and 300 times earnings.
As shown in columns B and C, BAC's earnings and dividends have had average annual growth of 9.1% and 14.4%, respectively. This is excellent growth, particularly in dividends. Column D shows that BAC's dividend payout has averaged 39.4% of earnings per share. Column D also shows that the dividend payout ratio has been rising significantly with dividends representing about 30% of earnings ten years ago and about 50% today. This is graphic evidence of a board of directors that is able and willing to return to its shareholders a fair cut of the profits. Column E shows that BAC has experienced price growth of 12% per year, which is similar to dividend growth, as is often the case with rising dividend stocks. To determine BAC's average annual total return, we add the average annual dividend yield of 3.45% to the average annual price increase of 12% to arrive at 15.45%.
There is much good information on Table 1, but, as they say, the past results are no guarantee of the future, therefore, let me cite two points that suggest BAC's prospects for the next ten years are sound.
1. Growing Earnings: It is not well understood that the US economy has been growing on average about 7% a year for the last 50 years. If you are a closet economist you will fuss and say that the economy has grown at only 3% a year. But both numbers are correct. The more widely accepted figure of 3% annual growth is adjusted for inflation, which has averaged 4% per year during this time, and measures real economic growth. But the 7% figure is also correct because it is the actual or gross rate of economic growth not adjusted for inflation. Since stock prices and other corporate financial data are not adjusted for inflation, an apples to apples comparison calls for us to use the 7% growth rate.
BAC is as close to being a nationwide banking operation as any financial institution we have in this country. If the US economy continues to expand at a gross rate of 7% per year, it is not a stretch of the imagination to predict that BAC will also grow earnings at least at 7% annually for the next decade.
2. Precedents for a Continued Rising Dividend: So, BAC has a bright future. That does not mean its dividends will keep pace with its earnings. How can we be sure that the company's board of directors will continue to give us our cut? The short answer is we don't know. We believe the best way to judge a company's likelihood of being fair to its shareholders is to look for precedents from its past. In this case, we mean dividend decisions they made when things were tough. There is a powerful precedent-setting action contained in Table 1.
In 1998, BAC's earnings fell nearly 20% versus the prior year. Remarkably, BAC, showing their unquestioned financial strength, raised their dividend by nearly 14%. We see three good things to take from their actions:
A. They correctly saw that the troubles of the time were temporary.
B. They did not make a token dividend increase; they raised their dividend at the same rate as they had been doing prior to the earnings weakness.
C. Their strategic actions prior to 1998 created a strong financial condition that allowed them to handle the rough spot with ease. (Thus, the importance of the "Quality Door.")
If you are like most people, who look only at price, you wake up every morning saying, "Should I sell my BAC and take my profit, or should I wait for another day when it might be higher?" Our guess is that most price-only investors who bought BAC in 1995 had a very tough time holding the stock in the late 1990s. The stock went flat from 1997 through 2002 (Column E), at a time when the investment world became inebriated with tech stocks. Yet, even though BAC's price was going nowhere, its dividend and underlying value were increasing by double digits every year. BAC's dividend went from $.69 in 1997 to a $1.22 in 2002. That is nearly an 80% increase in cash distributions and the price hardly moved. That alone should have been a warning that something was amiss with the market's valuation mechanism. In hindsight, it is now clear that during this time something other than valuation was driving stock prices. That something was the irrational exhuberance for the thin air of high flying techs. Understanding that your Yield at Cost was rising every year, may have given you enough incentive not to go chasing tech stocks that were trading at 200 and 300 times earnings.
As shown in columns B and C, BAC's earnings and dividends have had average annual growth of 9.1% and 14.4%, respectively. This is excellent growth, particularly in dividends. Column D shows that BAC's dividend payout has averaged 39.4% of earnings per share. Column D also shows that the dividend payout ratio has been rising significantly with dividends representing about 30% of earnings ten years ago and about 50% today. This is graphic evidence of a board of directors that is able and willing to return to its shareholders a fair cut of the profits. Column E shows that BAC has experienced price growth of 12% per year, which is similar to dividend growth, as is often the case with rising dividend stocks. To determine BAC's average annual total return, we add the average annual dividend yield of 3.45% to the average annual price increase of 12% to arrive at 15.45%.
There is much good information on Table 1, but, as they say, the past results are no guarantee of the future, therefore, let me cite two points that suggest BAC's prospects for the next ten years are sound.
1. Growing Earnings: It is not well understood that the US economy has been growing on average about 7% a year for the last 50 years. If you are a closet economist you will fuss and say that the economy has grown at only 3% a year. But both numbers are correct. The more widely accepted figure of 3% annual growth is adjusted for inflation, which has averaged 4% per year during this time, and measures real economic growth. But the 7% figure is also correct because it is the actual or gross rate of economic growth not adjusted for inflation. Since stock prices and other corporate financial data are not adjusted for inflation, an apples to apples comparison calls for us to use the 7% growth rate.
BAC is as close to being a nationwide banking operation as any financial institution we have in this country. If the US economy continues to expand at a gross rate of 7% per year, it is not a stretch of the imagination to predict that BAC will also grow earnings at least at 7% annually for the next decade.
2. Precedents for a Continued Rising Dividend: So, BAC has a bright future. That does not mean its dividends will keep pace with its earnings. How can we be sure that the company's board of directors will continue to give us our cut? The short answer is we don't know. We believe the best way to judge a company's likelihood of being fair to its shareholders is to look for precedents from its past. In this case, we mean dividend decisions they made when things were tough. There is a powerful precedent-setting action contained in Table 1.
In 1998, BAC's earnings fell nearly 20% versus the prior year. Remarkably, BAC, showing their unquestioned financial strength, raised their dividend by nearly 14%. We see three good things to take from their actions:
A. They correctly saw that the troubles of the time were temporary.
B. They did not make a token dividend increase; they raised their dividend at the same rate as they had been doing prior to the earnings weakness.
C. Their strategic actions prior to 1998 created a strong financial condition that allowed them to handle the rough spot with ease. (Thus, the importance of the "Quality Door.")
Donaldson Capital Management has been using a dividend oriented investment approach since our founding. Dividend investing, a we practice it, is suited for those people who want their investments to be safe, to provide much higher than average cash flows, and over time to provide capital gains comparable to the blue chip averages with much less volatility.
Next time I will discuss the long-term statistical correlations between dividend growth and price growth. I think you will be surprised at the findings.
Blessings,
*All data shown here is taken from sources believed to reliable. DCM cannot guarantee their accuracy. Data may not total correctly due to rounding.
Wednesday, March 01, 2006
Wells Fargo on the Move
As promised, I want to show you some charts of stocks that are breaking to new highs. The first is Wells Fargo, one of the largest and strongest banks in the United States. We have owned the stock in our Rising Dividend portfolio for many years, having received it when it bought one of our largest holdings Norwest Financial. We kept the stock because the top management of Norwest was tapped to run WFC. Richard Kovacevich was way ahead of his time is seeing the merits of cross selling. He institued initiatives to triple the number of products that each WFC customer used (checking, loans, credit cards, mortgage, etc.) WFC is big in mortgages, consumer loans, business loans, and wealth management.
WFC and other banks have been facing a number of headwinds: narrowing profit margins because of the rise in short-term interest rates; slowing in mortgage business resulting from a slow down in the real estate market; and worries about debt loads of consumers. In the face of all these issues, and moving against the grain of many other weak-performing banks, WFC recently broke out of a trading range and hit a new high.
I have shown WFC here on one of our Dividend Valuation Charts. Price is in dark green, and valuation is in gold. The model covers 21 years of the multiple correlations of WFC's price, dividends and bond yields. The R2 of the formula to the actual price is .93.
Wells Fargo -- 20 Year Price - Valuation
 This move against the grain by WFC is a very good sign that high quality stocks are shaking off their lethargy. But WFC's move begs the question: why are they doing so well, when many banks have not done much pricewise in years? Furthermore, when a stock breaks to a new high in the face of headwinds, it usually means a change is near. What might that change be?
I think WFC's move is a signal that very high quality companies are on the march. I will show more examples later. It also makes the case that some very smart people are betting that the worries about the housing bubble may be overblown, because WFC is one of the country's largest mortgage originators. Finally, WFC's counterintuitive move may be based on the counterintuitive idea that slower overall economic growth would be good for the markets. That would mean that the 14 rate hikes by the Fed are finally starting to bite.
Whatever the reason, a company like WFC does not break to a new high because it gets touted on CNBC. It does so based on the valuation work by very large investors. Our model says WFC's most probable selling price by the end of 2006 will be at least $73.
This move against the grain by WFC is a very good sign that high quality stocks are shaking off their lethargy. But WFC's move begs the question: why are they doing so well, when many banks have not done much pricewise in years? Furthermore, when a stock breaks to a new high in the face of headwinds, it usually means a change is near. What might that change be?
I think WFC's move is a signal that very high quality companies are on the march. I will show more examples later. It also makes the case that some very smart people are betting that the worries about the housing bubble may be overblown, because WFC is one of the country's largest mortgage originators. Finally, WFC's counterintuitive move may be based on the counterintuitive idea that slower overall economic growth would be good for the markets. That would mean that the 14 rate hikes by the Fed are finally starting to bite.
Whatever the reason, a company like WFC does not break to a new high because it gets touted on CNBC. It does so based on the valuation work by very large investors. Our model says WFC's most probable selling price by the end of 2006 will be at least $73.
 This move against the grain by WFC is a very good sign that high quality stocks are shaking off their lethargy. But WFC's move begs the question: why are they doing so well, when many banks have not done much pricewise in years? Furthermore, when a stock breaks to a new high in the face of headwinds, it usually means a change is near. What might that change be?
I think WFC's move is a signal that very high quality companies are on the march. I will show more examples later. It also makes the case that some very smart people are betting that the worries about the housing bubble may be overblown, because WFC is one of the country's largest mortgage originators. Finally, WFC's counterintuitive move may be based on the counterintuitive idea that slower overall economic growth would be good for the markets. That would mean that the 14 rate hikes by the Fed are finally starting to bite.
Whatever the reason, a company like WFC does not break to a new high because it gets touted on CNBC. It does so based on the valuation work by very large investors. Our model says WFC's most probable selling price by the end of 2006 will be at least $73.
This move against the grain by WFC is a very good sign that high quality stocks are shaking off their lethargy. But WFC's move begs the question: why are they doing so well, when many banks have not done much pricewise in years? Furthermore, when a stock breaks to a new high in the face of headwinds, it usually means a change is near. What might that change be?
I think WFC's move is a signal that very high quality companies are on the march. I will show more examples later. It also makes the case that some very smart people are betting that the worries about the housing bubble may be overblown, because WFC is one of the country's largest mortgage originators. Finally, WFC's counterintuitive move may be based on the counterintuitive idea that slower overall economic growth would be good for the markets. That would mean that the 14 rate hikes by the Fed are finally starting to bite.
Whatever the reason, a company like WFC does not break to a new high because it gets touted on CNBC. It does so based on the valuation work by very large investors. Our model says WFC's most probable selling price by the end of 2006 will be at least $73.
Tuesday, February 28, 2006
Google Takes on Value's Terrible Swift Sword.
According to our computations, the Dow Jones 30 is approximately 15% under valued. Dow Jones 11,000 has put up a stout defense for a long time, but everyday the valuation gap widens, and in time, value will win like it always does.
In my last edition, I explained that even though the Dow had pierced the 11,000 level I was not ready to lay it to rest. I mentioned that important psychological levels are usually taken out with a lot of noise caused by short covering. Since the move through 11,000 was very orderly, I suggested that it was unlikely that the shorts had covered and until they did, we would wobble back and forth across 11,000 for a while longer.
As I write this, Google has just announced that they see a slowing in their business; as a result, its stock price is down 10% and the Dow is down about 1%.
What does a high flyer like Google have to do with value investors like us. Nothing and everything. Google does not qualify for our portfolios because it does not pay dividends, and even if it did so, its current selling price has no relationship to any intrinsic value we know how to compute. Google is a fad. It has a wonderful business model and great services, but it is being priced like the techs of the late 1990s: as though the rules of valuation have been repealed. Google has been learning in recent weeks that value has a terrible swift sword, and in time, it visits every company.
I used to say that everyday in the market means something. I don't say that anymore because I know it is untrue. Few days in the market mean much, yet there are thousand of words being written today about what's going on with Google and the greater implications it has for all stocks. I will add as few words to this total as I can.
Google is not a value. The slicing and dicing it is receiving is warranted, and there will be more days like this. Blue Chip America is undervalued. The hit it is taking is not related to value, but psychology. Traders believe Google is one of the most important companies in the world, and if Google is suffering, then something must be wrong with the whole market.
Today the "Sell-Dow 11,000" crowd is winning, but their costs are going up everyday and they know it. They were on the right side of the valuation knife in 2000, and they have big winners. But they are on the wrong side of the battle this time, because some high quality companies with good values are breaking out of long trading ranges. I will detail some next time.
Friday, February 17, 2006
Dow Jones 11000 -- Good Bye, or See You Later?
The markets turned in a very good week spurred by the rather upbeat report new Fed Chairman Ben Bernanke gave congress about the strength of the US Economy. The Dow closed the week at 11,115.32, the highest close since mid-2001. I have had a number of people ask if I think the market will just keep going or if it will continue to oscillate around 11000 for awhile. As I said in the previous edition, 11,000 has, indeed, been a psychological barrier, thus The DJ 30's break to a new multi-year high is very good news. In addition, I still believe the Dow Jones is significantly undervalued; thus, there is plenty of room for the market to move higher.
Having said this, 11,000 has not been pierced in the way that psychological barriers are normally taken out. I said last time, the DJ 30 has been at or near 11,000 8 times in the last 5 years and has turned back every time. One of the reasons the market turned back each time is the influence of what are known as the "shorts." A short trade is when you sell a stock or index that you do not yet own (Shorts borrow the securities they sell from their brokers) with the hopes that the price will fall and you can buy it back later at a lower price and make a profit. Thus in the seven previous times the DJ 30 reached 11,000, if you had shorted it, you would have made handsome profits because each time the market subsequently fell back to lower prices. You could have then covered your short, by buying the same number of shares that you shorted and collected the difference as a capital gain. Big money, and I do mean big money has been made by the shorts over the last few years.
The shorts are big, sophisticated investors, and they do not scare easily. Without a shadow of a doubt they began shorting recently just under 11,000, and I believe they are probably still shorting today. While the shorts do not scare easily, they are completely short-term traders and they will not take losses indefinitely. The shorts will cover by buying the market when they are convinced that stocks are going a lot higher.
When they start to cover, they must buy the market, and they operate in a kind of herd mentality. That means when the shorts start to cover you will know it because it will be accompanied by very high volume and sharp spikes in prices, as many of them head for the exits.
So far the move above 11,000 has been rather orderly. For me to wave good bye to 11,000, I would like to see a week to 10 days of sharply higher prices. Busting out of a 5 year high ought to be worth 500 points in short covering.
This does not mean that this is the only way we can sing our dirge for 11,000, but it is the way that these kinds of psychological barriers normally are laid to rest.
I feel confident that 11,000 will be decisively pierced in 2006, but I think it will be accompanied by a lot more noise than we have today. I am bullish on the markets, but I would be surprised if we did not wobble around 11,000 for a while longer.
Friday, February 10, 2006
Dow Jones 11000 -- When Will it Fall?
I will defer my comments about speeches made at the TD Ameritrade National Conference to answer a great question from a client that everyone is asking. How long will 11,000 on the Dow Jones present a barrier to US common stock advances?
Normally, I'm not much into numerical barriers. The evidence is clear that in the long run stocks follow values and not psychological milestones, but I do admit that in the short run, a certain price level can seem impenetrable. I want to show you two charts that make the case that the Dow Jones is getting very cheap relative to its underlying value.
Chart I shows that 11,000 has, indeed, been a tough level to get through. I count 7 different times over the last 5 years when the Dow pushed toward 11,000, and the only time it broke decisively through that level was in early 2001, which was reversed by the events of 9/11.
Chart I
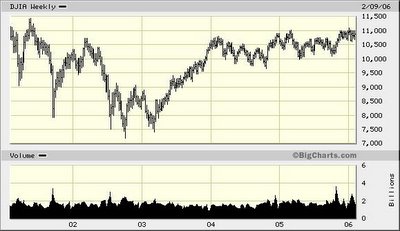 The question that everyone is asking is, "What is it that the sellers know about 11,000 that the buyers do not know?" My answer is simple; 11,000 is just the level where value and price have been near equilibrium and therefore it has been somewhat easy for the sellers to beat back the buyers without much of a fight. But I believe the time for that big fight is very near.
This can be seen using one of our Dividend Valuation charts for the Dow Jones 30.
Chart II
The question that everyone is asking is, "What is it that the sellers know about 11,000 that the buyers do not know?" My answer is simple; 11,000 is just the level where value and price have been near equilibrium and therefore it has been somewhat easy for the sellers to beat back the buyers without much of a fight. But I believe the time for that big fight is very near.
This can be seen using one of our Dividend Valuation charts for the Dow Jones 30.
Chart II
 Chart II shows 45 years of the annual price movements of the DJ30 (red line) versus our Dividend Valuation Model (blue line). The model clearly shows that stocks were overpriced between 1998 and 2000 (DJ30 Price far above Dividend Value). Thus, the reason that stocks had problems getting past 11,000 during that time was because value investors were willing to sell all the stock the momentum players wanted.
The chart shows that the DJ30 sharply corrected back toward its Dividend Valuation Line after 9/11. The underlying data for the chart reveal that the market became undervalued in 2002. For years 2003 and 2004, prices and values moved in tandem. But in 2005 the Dividend Valuation Line dramatically separated from the price of the DJ 30.
I have discussed this divergence between prices and values on several occasions over the past year, and it has puzzled me that the market was not able to break through more, even in the face of rate hikes, oil spikes, and natural disasters.
The chart shows that stocks have now gone sideways for 5 years, and I hear all sorts of analysts arguing that 11,000 is likely to be as difficult to pierce as was 1000, which was first broached in 1968 but not laid to rest until 1982. But in my mind this kind of talk is silly. A look at the chart shows why. There was no reason for stocks to have pierced 1000 in any meaningful way prior to the early 1980s because the movement of the Dividend Valuation Line went sideways during the same time.
Things are different now. The chart shows that the Dividend Valuation Line has decisively separated from the DJ 30. The model now projects that the proper valuation for the Dow today is just under 13,000. Before you either accept this figure as a foregone conclusion, or dismiss it, let me explain how the Dividend Valuation Model works and how accurate a predictor of stock prices it has been over the years.
The Dividend Valuation Model analyzes the mathematical relationships between dividends, interested rates, and prices over the last 45 years. This produces a "the way things ought to be" formula. That formula is then tested for its correlation to the actual results. This testing produces something statisticians call a coefficient of determination and a standard error. Hang in here with me; I'll get through these statistics in a moment. The bottom line is this. Our Dividend Valuation Model has "explained" 95% of the annual movements of the DJ 30 with a standard error of about 5%. That is to say, the probability for prices to move higher in 2006 are very high unless the economy just falls apart and takes dividends with it.
Psychological levels can not hold back the true worth of companies indefinitely, and what our model is saying is that stocks are probably undervalued by 15% - 20%. That does not mean the value gap will be closed completely in 2006, but it does mean that the sellers are on borrowed time unless something very negative happens to values. The way the model works, a significant fall in values could only occur if dividends fall dramatically in the year ahead. That is unlikely because the majority of the companies in the Dow are expected to raise their dividends.
Chart II shows 45 years of the annual price movements of the DJ30 (red line) versus our Dividend Valuation Model (blue line). The model clearly shows that stocks were overpriced between 1998 and 2000 (DJ30 Price far above Dividend Value). Thus, the reason that stocks had problems getting past 11,000 during that time was because value investors were willing to sell all the stock the momentum players wanted.
The chart shows that the DJ30 sharply corrected back toward its Dividend Valuation Line after 9/11. The underlying data for the chart reveal that the market became undervalued in 2002. For years 2003 and 2004, prices and values moved in tandem. But in 2005 the Dividend Valuation Line dramatically separated from the price of the DJ 30.
I have discussed this divergence between prices and values on several occasions over the past year, and it has puzzled me that the market was not able to break through more, even in the face of rate hikes, oil spikes, and natural disasters.
The chart shows that stocks have now gone sideways for 5 years, and I hear all sorts of analysts arguing that 11,000 is likely to be as difficult to pierce as was 1000, which was first broached in 1968 but not laid to rest until 1982. But in my mind this kind of talk is silly. A look at the chart shows why. There was no reason for stocks to have pierced 1000 in any meaningful way prior to the early 1980s because the movement of the Dividend Valuation Line went sideways during the same time.
Things are different now. The chart shows that the Dividend Valuation Line has decisively separated from the DJ 30. The model now projects that the proper valuation for the Dow today is just under 13,000. Before you either accept this figure as a foregone conclusion, or dismiss it, let me explain how the Dividend Valuation Model works and how accurate a predictor of stock prices it has been over the years.
The Dividend Valuation Model analyzes the mathematical relationships between dividends, interested rates, and prices over the last 45 years. This produces a "the way things ought to be" formula. That formula is then tested for its correlation to the actual results. This testing produces something statisticians call a coefficient of determination and a standard error. Hang in here with me; I'll get through these statistics in a moment. The bottom line is this. Our Dividend Valuation Model has "explained" 95% of the annual movements of the DJ 30 with a standard error of about 5%. That is to say, the probability for prices to move higher in 2006 are very high unless the economy just falls apart and takes dividends with it.
Psychological levels can not hold back the true worth of companies indefinitely, and what our model is saying is that stocks are probably undervalued by 15% - 20%. That does not mean the value gap will be closed completely in 2006, but it does mean that the sellers are on borrowed time unless something very negative happens to values. The way the model works, a significant fall in values could only occur if dividends fall dramatically in the year ahead. That is unlikely because the majority of the companies in the Dow are expected to raise their dividends.
 The question that everyone is asking is, "What is it that the sellers know about 11,000 that the buyers do not know?" My answer is simple; 11,000 is just the level where value and price have been near equilibrium and therefore it has been somewhat easy for the sellers to beat back the buyers without much of a fight. But I believe the time for that big fight is very near.
This can be seen using one of our Dividend Valuation charts for the Dow Jones 30.
Chart II
The question that everyone is asking is, "What is it that the sellers know about 11,000 that the buyers do not know?" My answer is simple; 11,000 is just the level where value and price have been near equilibrium and therefore it has been somewhat easy for the sellers to beat back the buyers without much of a fight. But I believe the time for that big fight is very near.
This can be seen using one of our Dividend Valuation charts for the Dow Jones 30.
Chart II
 Chart II shows 45 years of the annual price movements of the DJ30 (red line) versus our Dividend Valuation Model (blue line). The model clearly shows that stocks were overpriced between 1998 and 2000 (DJ30 Price far above Dividend Value). Thus, the reason that stocks had problems getting past 11,000 during that time was because value investors were willing to sell all the stock the momentum players wanted.
The chart shows that the DJ30 sharply corrected back toward its Dividend Valuation Line after 9/11. The underlying data for the chart reveal that the market became undervalued in 2002. For years 2003 and 2004, prices and values moved in tandem. But in 2005 the Dividend Valuation Line dramatically separated from the price of the DJ 30.
I have discussed this divergence between prices and values on several occasions over the past year, and it has puzzled me that the market was not able to break through more, even in the face of rate hikes, oil spikes, and natural disasters.
The chart shows that stocks have now gone sideways for 5 years, and I hear all sorts of analysts arguing that 11,000 is likely to be as difficult to pierce as was 1000, which was first broached in 1968 but not laid to rest until 1982. But in my mind this kind of talk is silly. A look at the chart shows why. There was no reason for stocks to have pierced 1000 in any meaningful way prior to the early 1980s because the movement of the Dividend Valuation Line went sideways during the same time.
Things are different now. The chart shows that the Dividend Valuation Line has decisively separated from the DJ 30. The model now projects that the proper valuation for the Dow today is just under 13,000. Before you either accept this figure as a foregone conclusion, or dismiss it, let me explain how the Dividend Valuation Model works and how accurate a predictor of stock prices it has been over the years.
The Dividend Valuation Model analyzes the mathematical relationships between dividends, interested rates, and prices over the last 45 years. This produces a "the way things ought to be" formula. That formula is then tested for its correlation to the actual results. This testing produces something statisticians call a coefficient of determination and a standard error. Hang in here with me; I'll get through these statistics in a moment. The bottom line is this. Our Dividend Valuation Model has "explained" 95% of the annual movements of the DJ 30 with a standard error of about 5%. That is to say, the probability for prices to move higher in 2006 are very high unless the economy just falls apart and takes dividends with it.
Psychological levels can not hold back the true worth of companies indefinitely, and what our model is saying is that stocks are probably undervalued by 15% - 20%. That does not mean the value gap will be closed completely in 2006, but it does mean that the sellers are on borrowed time unless something very negative happens to values. The way the model works, a significant fall in values could only occur if dividends fall dramatically in the year ahead. That is unlikely because the majority of the companies in the Dow are expected to raise their dividends.
Chart II shows 45 years of the annual price movements of the DJ30 (red line) versus our Dividend Valuation Model (blue line). The model clearly shows that stocks were overpriced between 1998 and 2000 (DJ30 Price far above Dividend Value). Thus, the reason that stocks had problems getting past 11,000 during that time was because value investors were willing to sell all the stock the momentum players wanted.
The chart shows that the DJ30 sharply corrected back toward its Dividend Valuation Line after 9/11. The underlying data for the chart reveal that the market became undervalued in 2002. For years 2003 and 2004, prices and values moved in tandem. But in 2005 the Dividend Valuation Line dramatically separated from the price of the DJ 30.
I have discussed this divergence between prices and values on several occasions over the past year, and it has puzzled me that the market was not able to break through more, even in the face of rate hikes, oil spikes, and natural disasters.
The chart shows that stocks have now gone sideways for 5 years, and I hear all sorts of analysts arguing that 11,000 is likely to be as difficult to pierce as was 1000, which was first broached in 1968 but not laid to rest until 1982. But in my mind this kind of talk is silly. A look at the chart shows why. There was no reason for stocks to have pierced 1000 in any meaningful way prior to the early 1980s because the movement of the Dividend Valuation Line went sideways during the same time.
Things are different now. The chart shows that the Dividend Valuation Line has decisively separated from the DJ 30. The model now projects that the proper valuation for the Dow today is just under 13,000. Before you either accept this figure as a foregone conclusion, or dismiss it, let me explain how the Dividend Valuation Model works and how accurate a predictor of stock prices it has been over the years.
The Dividend Valuation Model analyzes the mathematical relationships between dividends, interested rates, and prices over the last 45 years. This produces a "the way things ought to be" formula. That formula is then tested for its correlation to the actual results. This testing produces something statisticians call a coefficient of determination and a standard error. Hang in here with me; I'll get through these statistics in a moment. The bottom line is this. Our Dividend Valuation Model has "explained" 95% of the annual movements of the DJ 30 with a standard error of about 5%. That is to say, the probability for prices to move higher in 2006 are very high unless the economy just falls apart and takes dividends with it.
Psychological levels can not hold back the true worth of companies indefinitely, and what our model is saying is that stocks are probably undervalued by 15% - 20%. That does not mean the value gap will be closed completely in 2006, but it does mean that the sellers are on borrowed time unless something very negative happens to values. The way the model works, a significant fall in values could only occur if dividends fall dramatically in the year ahead. That is unlikely because the majority of the companies in the Dow are expected to raise their dividends.
I am certainly not making gurantees, and the future will bring many surprises, but the great thing about dividend investing is that at least we know what we are looking for, and that is this: If dividends grow as we expect in the year ahead, and if interest rates remain tame, some time in 2006 we will sing a funeral dirge for Dow 11,000.
Monday, February 06, 2006
TD Ameritrade National Conference
Several members of our firm attended the TD Ameritrade (the new name of the merger of TD Waterhouse and Ameritrade) annual advisors conference last week. This was one of the best conferences I have ever attended, and I want to share excerpts of a number of speakers, but I want to comment on the speech by Dr. Alan Blinder first. Blinder's comments were of interest for three reasons: 1. He is one of the Democratic Party's heavyweight thinkers on the economy; 2. He was the vice-chairman of the Fed during the Clinton years and thus has keen insights into the thinking of outgoing Fed Chairman Alan Greenspan; and 3. He has worked closely with Ben Bernanke, the new Fed Chairman, while both were professors at Princeton University.
My key interest in Dr. Blinder's comments were his views on the economy. I was pleasantly surprised to hear that he agrees with most economists that 2006 GDP growth will be in the range of 3.5% - 4%. That is actually higher than DCM's estimate of 3%. He thought the recently announced fourth quarter reading of 1.1% annual growth was a fluke that would be compensated for by higher than trend growth in the first quarter.
He was asked about the balance of trade issues with China and other countries. He said that David Ricardo 200 years ago theorized and history had proved that foreign trade is not destructive to job creation. He said if the US were truly exporting jobs, then how could the unemployment rate be only 4.7%. He said the theory of comparative advantage currently says that the most efficient and cost effective place to produce televisions was in Asia, and the best place to produce airplanes was the US. He said you disrupt and weaken an economy by trying to hang on to inefficient and non-competitive industries and jobs. He did not say it, but the outsourcing of manufacturing jobs has been going on for 40 years, and the rise in manufacturing outside the US has caused jobs in shipping, transportation, and warehousing to skyrocket. You could walk across the US on a busy day on the trailer tops of 18 wheelers.
He had harsh things to say about the budget deficits and called on President Bush to abandon his efforts to make permanent the tax cuts instituted in 2001 and 2003. I had the very strong sense, however, that if President Clinton would have been in office on 9/11, Dr. Blinder would have recommended tax cuts to spur the economy and consumer confidence.
In summary, I have followed Dr. Blinder for many years and found him to be a reasonably main stream economist. He takes a populist line from time to time, but I do not believe he harbors notions that the government creates jobs or can do much to stem the free flow of capital. If John Kerry would have won the Presidency, I am reasonably certain Dr. Blinder would have been on his shortlist to replace Dr. Greenspan. I am much happier that Dr. Bernanke is the new Fed Chairman, but I think the markets would have been OK with Dr. Blinder.
Next, I'll detail some of Dr. Blinder's thoughts on Ben Bernanke.
PS: We obviously were interested in what the merger of TD Waterhouse and Ameritrade would mean to our clients and us. We had previously been told that the TD Waterhouse Institutional Services'management team would take the lead in custodial services to money managers such as Donaldson Capital Management. That was confirmed in Orlando. As a result, I see few if any changes in the near term.
odds & ends
Subscribe to:
Posts (Atom)