 Table II has a lot going on, so let us describe the major points we will be discussing. The table shows the rates of returns for prices and dividends and the variability of the returns over the last five decades of the Dow Jones Industrial Average. The table compares the well-known concept of investment total return with our less well known “Total Dividend Return.” Our purpose in showing this table is to complete our discussion of a point we brought up earlier about dividends. We said the following:
“Importantly, our research shows that in the case of the DJIA, the steadily rising dividends have not only increased the investment returns they have also provided an important indication of the valuation of the DJIA itself. . . .”
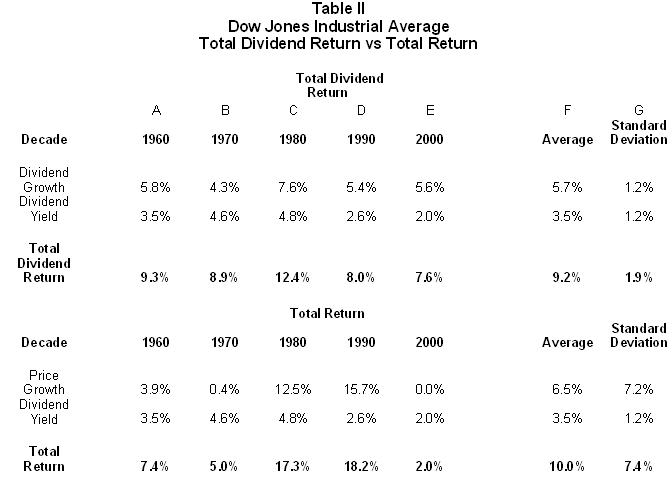
At Donaldson Capital Management, we often say that many of our companies’ dividends are consistent and persistent. Just how consistent they are may surprise you. Earlier we said that the cumulative dividends of the DJIA have risen about 8 out every 10 years. The upper half of Table II shows dividend growth and dividend yield over the last five decades. Column A shows in the 1960s dividends grew by an average of 5.8% per year. Column F reveals that the average dividend growth for the last five decades has been 5.7%. The chart vividly shows that dividend growth has been very consistent during this time, with only the 7.6% growth in 1980s diverging very far from the growth of the other decades. We investigated this divergence and found that it was driven by the large dividend increases that companies made in 1987 and 1988. This was in the aftermath of the stock market crash in 1987, and we believe the outsized increases were the DJIA companies’ attempt to reassure their shareholders. We believe this precedent has big ramifications for today, which we will address shortly.
For the last five decades the standard deviation (average volatility) of dividend growth (Column G) has been only 1.2%. Statistically, dividend growth by decade has been remarkably stable.
Dividend yield by decade is in the row just under dividend growth. The average dividend yield for the five decades is shown in column G as 3.5%. Total return is defined as price appreciation plus dividend yield. In our “Total Dividend Return,” we substitute dividend growth for price appreciation. Thus, “Total Dividend Return” is equal to dividend growth plus dividend yield.
Total Dividend Return by decade for the DJIA has ranged from a low of 7.5% for the first half of the current decade, to a high of 12.3% for the decade of the 1980s. The five-decade average for DJIA Total Dividend Return has been 9.2% (Column F), again with a miniscule standard deviation of 1.9%.
Our theory holds that in the long-run, the total return of a stock should be approximately equal to its dividend yield plus its dividend growth, or as we have explained here, its Total Dividend Return. The reason is simple. If a company is giving its shareholders their fair cut of the profits, it should show up in the stock price. The stock market is a pricing machine. The more transparent a company is with their dividend policy, the more accurately the market will price their stock.
The average Total Dividend Return of 9.2% over the last five decades should sound very familiar. If it does not, the bottom half of Table 3 will refresh your memory. For the last five decades, the Dow Jones Industrial Average has averaged an annual total return of 10%, as shown in Column F. This has consisted of 6.5% average price growth and 3.5% average dividend yield (Column F).
It is eye opening that Total Dividend Return and total return in the DJIA have been so similar. Investors could have ignored the news of recessions, wars, oil shocks, assassinations, and tech bubbles. They could have dropped their subscriptions to the Wall Street Journal and pulled the plug on the talking heads on CNBC. They could have breathed easier each time a crisis of any kind came along; indeed, they could have dramatically reduced the time they invested in keeping up with the Dow Joneses. Instead, they could have watched just two things, the dividend growth and the dividend yield of the DJIA, and achieved over 90% of the rate of return of the index. But of equal importance, they could have done so with 75% less volatility than with the DJIA itself. The standard deviation of the Total Dividend Return as shown in Column F has been only 1.9% on an average return of 9.2%. This is in sharp contrast to the 7.4% standard deviation of the DJIA on its 10% average annual return.
We believe viewing the stock market or an individual stock from a dividend perspective is the right approach for most people. Dividends not only contribute directly to investment returns because they are real money, but they also have predictive powers for stock price appreciation, as well.
Table II has a lot going on, so let us describe the major points we will be discussing. The table shows the rates of returns for prices and dividends and the variability of the returns over the last five decades of the Dow Jones Industrial Average. The table compares the well-known concept of investment total return with our less well known “Total Dividend Return.” Our purpose in showing this table is to complete our discussion of a point we brought up earlier about dividends. We said the following:
“Importantly, our research shows that in the case of the DJIA, the steadily rising dividends have not only increased the investment returns they have also provided an important indication of the valuation of the DJIA itself. . . .”
At Donaldson Capital Management, we often say that many of our companies’ dividends are consistent and persistent. Just how consistent they are may surprise you. Earlier we said that the cumulative dividends of the DJIA have risen about 8 out every 10 years. The upper half of Table II shows dividend growth and dividend yield over the last five decades. Column A shows in the 1960s dividends grew by an average of 5.8% per year. Column F reveals that the average dividend growth for the last five decades has been 5.7%. The chart vividly shows that dividend growth has been very consistent during this time, with only the 7.6% growth in 1980s diverging very far from the growth of the other decades. We investigated this divergence and found that it was driven by the large dividend increases that companies made in 1987 and 1988. This was in the aftermath of the stock market crash in 1987, and we believe the outsized increases were the DJIA companies’ attempt to reassure their shareholders. We believe this precedent has big ramifications for today, which we will address shortly.
For the last five decades the standard deviation (average volatility) of dividend growth (Column G) has been only 1.2%. Statistically, dividend growth by decade has been remarkably stable.
Dividend yield by decade is in the row just under dividend growth. The average dividend yield for the five decades is shown in column G as 3.5%. Total return is defined as price appreciation plus dividend yield. In our “Total Dividend Return,” we substitute dividend growth for price appreciation. Thus, “Total Dividend Return” is equal to dividend growth plus dividend yield.
Total Dividend Return by decade for the DJIA has ranged from a low of 7.5% for the first half of the current decade, to a high of 12.3% for the decade of the 1980s. The five-decade average for DJIA Total Dividend Return has been 9.2% (Column F), again with a miniscule standard deviation of 1.9%.
Our theory holds that in the long-run, the total return of a stock should be approximately equal to its dividend yield plus its dividend growth, or as we have explained here, its Total Dividend Return. The reason is simple. If a company is giving its shareholders their fair cut of the profits, it should show up in the stock price. The stock market is a pricing machine. The more transparent a company is with their dividend policy, the more accurately the market will price their stock.
The average Total Dividend Return of 9.2% over the last five decades should sound very familiar. If it does not, the bottom half of Table 3 will refresh your memory. For the last five decades, the Dow Jones Industrial Average has averaged an annual total return of 10%, as shown in Column F. This has consisted of 6.5% average price growth and 3.5% average dividend yield (Column F).
It is eye opening that Total Dividend Return and total return in the DJIA have been so similar. Investors could have ignored the news of recessions, wars, oil shocks, assassinations, and tech bubbles. They could have dropped their subscriptions to the Wall Street Journal and pulled the plug on the talking heads on CNBC. They could have breathed easier each time a crisis of any kind came along; indeed, they could have dramatically reduced the time they invested in keeping up with the Dow Joneses. Instead, they could have watched just two things, the dividend growth and the dividend yield of the DJIA, and achieved over 90% of the rate of return of the index. But of equal importance, they could have done so with 75% less volatility than with the DJIA itself. The standard deviation of the Total Dividend Return as shown in Column F has been only 1.9% on an average return of 9.2%. This is in sharp contrast to the 7.4% standard deviation of the DJIA on its 10% average annual return.
We believe viewing the stock market or an individual stock from a dividend perspective is the right approach for most people. Dividends not only contribute directly to investment returns because they are real money, but they also have predictive powers for stock price appreciation, as well.

Thursday, March 16, 2006
In the Long run, Price Follow Dividends -- Part II
Aside from describing the market’s apparent mispricing of BAC, our discussion of Donaldson Capital Management’s Yield to Cost methodology has spent very little time addressing stock prices. We have been saying for a long time that people agonize over current prices much more than they should. The average difference between the high and low of an individual stock in a typical year is nearly 30%. This is just the nature of the beast, stocks go up and down. Sometimes there is a good reason; most times they just go up and down because speculators are hurling stocks back and forth among themselves for reasons known only to them. But, as we mentioned earlier, dividends are remarkably stable and consistent, and in the long-term they are highly correlated to stock prices. Table II below is an eyeful and has profound consequences for investors of all ages. We believe that it shows that there is another way of investing that is less volatile, more predictable, and yet, offers similar rates of return as does a capital growth oriented style of investment strategy. Please study this table. In our judgment, it does more to de-mystify investing than anything we have ever written.
 Table II has a lot going on, so let us describe the major points we will be discussing. The table shows the rates of returns for prices and dividends and the variability of the returns over the last five decades of the Dow Jones Industrial Average. The table compares the well-known concept of investment total return with our less well known “Total Dividend Return.” Our purpose in showing this table is to complete our discussion of a point we brought up earlier about dividends. We said the following:
“Importantly, our research shows that in the case of the DJIA, the steadily rising dividends have not only increased the investment returns they have also provided an important indication of the valuation of the DJIA itself. . . .”
At Donaldson Capital Management, we often say that many of our companies’ dividends are consistent and persistent. Just how consistent they are may surprise you. Earlier we said that the cumulative dividends of the DJIA have risen about 8 out every 10 years. The upper half of Table II shows dividend growth and dividend yield over the last five decades. Column A shows in the 1960s dividends grew by an average of 5.8% per year. Column F reveals that the average dividend growth for the last five decades has been 5.7%. The chart vividly shows that dividend growth has been very consistent during this time, with only the 7.6% growth in 1980s diverging very far from the growth of the other decades. We investigated this divergence and found that it was driven by the large dividend increases that companies made in 1987 and 1988. This was in the aftermath of the stock market crash in 1987, and we believe the outsized increases were the DJIA companies’ attempt to reassure their shareholders. We believe this precedent has big ramifications for today, which we will address shortly.
For the last five decades the standard deviation (average volatility) of dividend growth (Column G) has been only 1.2%. Statistically, dividend growth by decade has been remarkably stable.
Dividend yield by decade is in the row just under dividend growth. The average dividend yield for the five decades is shown in column G as 3.5%. Total return is defined as price appreciation plus dividend yield. In our “Total Dividend Return,” we substitute dividend growth for price appreciation. Thus, “Total Dividend Return” is equal to dividend growth plus dividend yield.
Total Dividend Return by decade for the DJIA has ranged from a low of 7.5% for the first half of the current decade, to a high of 12.3% for the decade of the 1980s. The five-decade average for DJIA Total Dividend Return has been 9.2% (Column F), again with a miniscule standard deviation of 1.9%.
Our theory holds that in the long-run, the total return of a stock should be approximately equal to its dividend yield plus its dividend growth, or as we have explained here, its Total Dividend Return. The reason is simple. If a company is giving its shareholders their fair cut of the profits, it should show up in the stock price. The stock market is a pricing machine. The more transparent a company is with their dividend policy, the more accurately the market will price their stock.
The average Total Dividend Return of 9.2% over the last five decades should sound very familiar. If it does not, the bottom half of Table 3 will refresh your memory. For the last five decades, the Dow Jones Industrial Average has averaged an annual total return of 10%, as shown in Column F. This has consisted of 6.5% average price growth and 3.5% average dividend yield (Column F).
It is eye opening that Total Dividend Return and total return in the DJIA have been so similar. Investors could have ignored the news of recessions, wars, oil shocks, assassinations, and tech bubbles. They could have dropped their subscriptions to the Wall Street Journal and pulled the plug on the talking heads on CNBC. They could have breathed easier each time a crisis of any kind came along; indeed, they could have dramatically reduced the time they invested in keeping up with the Dow Joneses. Instead, they could have watched just two things, the dividend growth and the dividend yield of the DJIA, and achieved over 90% of the rate of return of the index. But of equal importance, they could have done so with 75% less volatility than with the DJIA itself. The standard deviation of the Total Dividend Return as shown in Column F has been only 1.9% on an average return of 9.2%. This is in sharp contrast to the 7.4% standard deviation of the DJIA on its 10% average annual return.
We believe viewing the stock market or an individual stock from a dividend perspective is the right approach for most people. Dividends not only contribute directly to investment returns because they are real money, but they also have predictive powers for stock price appreciation, as well.
Table II has a lot going on, so let us describe the major points we will be discussing. The table shows the rates of returns for prices and dividends and the variability of the returns over the last five decades of the Dow Jones Industrial Average. The table compares the well-known concept of investment total return with our less well known “Total Dividend Return.” Our purpose in showing this table is to complete our discussion of a point we brought up earlier about dividends. We said the following:
“Importantly, our research shows that in the case of the DJIA, the steadily rising dividends have not only increased the investment returns they have also provided an important indication of the valuation of the DJIA itself. . . .”
At Donaldson Capital Management, we often say that many of our companies’ dividends are consistent and persistent. Just how consistent they are may surprise you. Earlier we said that the cumulative dividends of the DJIA have risen about 8 out every 10 years. The upper half of Table II shows dividend growth and dividend yield over the last five decades. Column A shows in the 1960s dividends grew by an average of 5.8% per year. Column F reveals that the average dividend growth for the last five decades has been 5.7%. The chart vividly shows that dividend growth has been very consistent during this time, with only the 7.6% growth in 1980s diverging very far from the growth of the other decades. We investigated this divergence and found that it was driven by the large dividend increases that companies made in 1987 and 1988. This was in the aftermath of the stock market crash in 1987, and we believe the outsized increases were the DJIA companies’ attempt to reassure their shareholders. We believe this precedent has big ramifications for today, which we will address shortly.
For the last five decades the standard deviation (average volatility) of dividend growth (Column G) has been only 1.2%. Statistically, dividend growth by decade has been remarkably stable.
Dividend yield by decade is in the row just under dividend growth. The average dividend yield for the five decades is shown in column G as 3.5%. Total return is defined as price appreciation plus dividend yield. In our “Total Dividend Return,” we substitute dividend growth for price appreciation. Thus, “Total Dividend Return” is equal to dividend growth plus dividend yield.
Total Dividend Return by decade for the DJIA has ranged from a low of 7.5% for the first half of the current decade, to a high of 12.3% for the decade of the 1980s. The five-decade average for DJIA Total Dividend Return has been 9.2% (Column F), again with a miniscule standard deviation of 1.9%.
Our theory holds that in the long-run, the total return of a stock should be approximately equal to its dividend yield plus its dividend growth, or as we have explained here, its Total Dividend Return. The reason is simple. If a company is giving its shareholders their fair cut of the profits, it should show up in the stock price. The stock market is a pricing machine. The more transparent a company is with their dividend policy, the more accurately the market will price their stock.
The average Total Dividend Return of 9.2% over the last five decades should sound very familiar. If it does not, the bottom half of Table 3 will refresh your memory. For the last five decades, the Dow Jones Industrial Average has averaged an annual total return of 10%, as shown in Column F. This has consisted of 6.5% average price growth and 3.5% average dividend yield (Column F).
It is eye opening that Total Dividend Return and total return in the DJIA have been so similar. Investors could have ignored the news of recessions, wars, oil shocks, assassinations, and tech bubbles. They could have dropped their subscriptions to the Wall Street Journal and pulled the plug on the talking heads on CNBC. They could have breathed easier each time a crisis of any kind came along; indeed, they could have dramatically reduced the time they invested in keeping up with the Dow Joneses. Instead, they could have watched just two things, the dividend growth and the dividend yield of the DJIA, and achieved over 90% of the rate of return of the index. But of equal importance, they could have done so with 75% less volatility than with the DJIA itself. The standard deviation of the Total Dividend Return as shown in Column F has been only 1.9% on an average return of 9.2%. This is in sharp contrast to the 7.4% standard deviation of the DJIA on its 10% average annual return.
We believe viewing the stock market or an individual stock from a dividend perspective is the right approach for most people. Dividends not only contribute directly to investment returns because they are real money, but they also have predictive powers for stock price appreciation, as well.