Wednesday, August 14, 2013

When the Dust Settles: Dividend Stocks Still the Place to Be

Tilt to Growth Stocks is Paying Off
At the beginning of the year, investors were driving up the prices of defensive stocks (health care, utilities, and consumer staple) over more growth-oriented stocks (financials, cyclical, industrials. In a traditional bull market, growth stocks lead the charge. At the time, investors were willing to pay almost as much per dollar of earnings (expressed by the P/E ratio) for safety and income as they were for growth. In fact, utilities were trading at a higher P/E than industrials and financials. The market was being driven by fear and growth stocks were not being rewarded.

We knew that would change. As we stated in our May 20, 2013 Take Aways, “The market will begin to be driven more by greed than fear. As that happens, we expect investors to shift their focus from defensive sectors to more growth-oriented, cyclical stocks.”

Wednesday, August 07, 2013

Cross Currents Aplenty, Improving Fundamentals Will Prevail

Earnings Growth: Modest Growth, but Better-Than-Expected
Company earnings and revenue growth for the S&P 500 during the 2nd quarter have both surprised to the upside. Earnings growth, as reported so far, has been about 3% higher than the 2nd Quarter in 2012 – led by Financials up nearly 9%. Revenue growth so far has been just under 1.5% – despite the Energy sector reporting 9% lower sales than a year ago.

Prior to the release of 2nd quarter earnings, the expectations were very low. While these revenue and earnings growth appear to be modest, they were better than expected – which gave the market a lift. Nearly 70% of companies beat expectations.

Companies are Not Cutting Back
There is little evidence that businesses have achieved earnings growth from cost-cutting. According to JPMorgan research, only 9 of the 228 companies that have reported thus far have boosted earnings based on higher sales and lower expenses. Companies have grown earnings by increasing revenue, investing in new technology, research and advertising – not by reducing expenses as many analysts had feared.

Friday, August 02, 2013

Take Aways

We would like to introduce you to a feature on our website called the “Investment Policy Committee (IPC) Take Aways”.  The Take Aways are weekly write-ups of discussion from the Investment Policy Committee meetings.  They summarize our collective thoughts about the economy, interest rates, stock prices, news, and other topics of interest.They are not meant to replace the blog, but rather to provide a way to convey our views about the markets on a more timely and regular basis.  Below are the Take Aways from the most recent IPC meeting (7/29/13):  

Friday, June 07, 2013

An Article We Wrote for Seeking Alpha Regarding Dividend-Paying Stocks

The following is a link to an article we wrote for the financial website Seeking Alpha.  This article discusses several topics, including dividend-paying stocks, Federal Reserve Policy, the strength of the economy, and how soon the Fed may begin the tapering of their Quantitative Easing program


http://seekingalpha.com/article/1486371-the-fed-jawboned-dividend-stocks-lower-but-it-won-t-last

Friday, May 03, 2013

Citizens of Bondsville: Welcome to Dividendsville

Many in the financial media are wringing their hands that the current bull market in stocks isn’t acting right.  "It’s too defensive," they say.  Put another way, they believe the wrong kinds of stocks are leading this bull; therefore, it is not to be trusted.  Nothing could be further from the truth.  One day these growling bears will admit they are wrong and come charging into this bull market.  That will be the sign for us believers to know it’s time to leave.  But, our guess is that time is a long way off.

The right stocks for a normal bull market are the so-called cyclical stocks – Basic Materials, Financials, Consumer Cyclicals, Industrials and Techs.  These kinds of companies sell products that last for three years and longer.  An uptick in these sectors of the stock market would mean that new incremental buying is occurring in these “long-term” sectors and would mean that big employment gains should be very near.

The leaders of the current uptrend in stocks are the defensive stocks – Consumer Staples, Healthcare and Utilities.  Companies in these sectors sell products we buy and use every day -- think of Procter and Gamble as the epitome of a defensive stock and Caterpillar as its counterpart.  One can’t put off the purchase of Crest toothpaste nearly as long as they can put off buying a new D9 earth mover.

Today’s bull market is not a classic bull market from the perspective of what kinds of companies are leading the pack, but it is a bull market nevertheless.  The easiest way to think of it is as an asset-allocation shift bull market.  As the Fed has continued to keep interest rates near zero, more and more investors have decided to flee their poor treatment in Bondsville to head for better returns in the suburbs.  They have traveled through the nearby communities of Junk Bondsville, Preferred Stockville, and - in recent months - have been moving into Dividendsville.

They have said, “I would rather take the risk of owning the common stock of Procter and Gamble or McDonalds than accept a 1.6% taxable return from a 10-year U.S. Treasury Bond.”

Certain types of large, multinational stocks are now being seen as having less risk than U.S. Treasury bonds.  The math is simple:  On an after-tax, inflation-adjusted basis the 10-year Treasury is a sure loser over its lifetime.  That’s not even considering the sad shape U.S. Government finances are in today.  On the other hand, Procter and Gamble (PG) and McDonalds (MCD) are companies that have taken on all comers and are not only still standing, but prospering.  Both have dividend yields near 3%.  

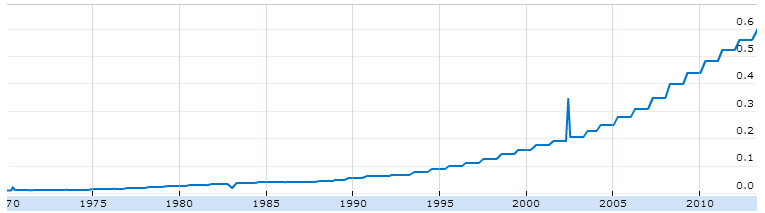
PG has paid a dividend since 1891 and raised it for 59 consecutive years.  PG’s dividend has risen at an annual rate of over 8% during the last three years and over 9% in the last five years.  At an 8% growth in its annual dividend, PG’s dividend will double in nine years.  Even if PG’s stock price does not move a penny over the next nine years, its dividend yield will rise to 6% - based on today’s price.  Its internal rate of return would be about 4.5% from dividends alone.

Proctor & Gamble (PG) Dividend since 1970
MCD’s dividend growth of near 12% per annum over the last three years and 3-5 year projected growth rate are both higher than PG’s.  

Procter and Gamble and McDonalds are not the only members of Dividendsville.  There are nearly 100 (and growing) companies worldwide that are becoming viewed as being safer than governments.

You won’t find these kinds of companies standing in line for government hand outs.  Indeed, it is the taxes these companies pay year after year that the U.S. government is so anxious to give away.

These companies cannot create income through taxation, but they can do something even better – compete.  They balance their books every year.  They navigate the byzantine regulations in every country in which they do business.  They hire and train employees for jobs that have a future.  They innovate.  They take risks.  They give back to every country and community in which they do business.  And - most importantly - they build flexibility into their decision-making that allows them to be profitable nearly every single year. 

Compared to bond yields, the current dividend yields of PG, MCD, and a host of other similar companies are actually higher than they should be.  If the current slow growth economy continues through the end of this year, we believe dividend yields for these kinds of companies will fall to nearly 2.5%.  For dividend yields to fall despite rising dividends for these companies, it would mean their stock prices would have to rise 15% or more between now and then. 

This might seem like an overly aggressive view of the performance potential for these stocks, but there is a line forming in the heart of Bondsville that stretches as far as the eye can see.  They are leaving town.  Whether or not they know it now, they will find their way to Dividendsville.  When they do, they will never leave.   


Our clients and staff own MCD and PG.

This discussion is provided for information purposes only.  Please consult your investment advisor concerning any ideas expressed here.  

Friday, April 19, 2013

Boston Marathon Explosions: Long-Term Effects on the Stock Market

The bombing at the finish line of the Boston Marathon was a senseless act of violence.  The victims are certainly in our thoughts and prayers.

It is in moments of great tragedy that America shows its unity and resiliency.  In these very same moments, at least in the short-term, the stock market is far less resilient.  At 2:50 pm EST on Monday (approximate time of the explosion), the S&P 500 was trading at 1,567.  Over the next hour, it dropped 0.8% to close at 1,552.

Could this be the event that puts an end to the recent strong stock market?

Not likely.

Historically, these shocking events have had little long-term effect.  We believe the Boston Marathon attacks will prove to be no different. The chart below shows the stock markets’ reaction to seven of the most significant natural disasters and terrorist acts of the past 20 years:


The chart shows the number of trading days it took the S&P 500 to close at a price higher than the day of the incident (or day previous if the event occurred on weekend or during closed markets).  As you can see, the most significant event was the terrorists’ attacks on September 11th.  In seven trading days, the market plummeted 11%.  In the 10 trading days following that low, the market recovered above where it opened on September 11th. While each of these seven cataclysmic events created anxiety and uncertainty for long periods after they occurred, they had virtually no long-term effect on the stock market.

The events on April 15th were a reminder that evil still resides in some dark souls, but the markets will continue to be driven in the future as they have been in the past - by corporate earnings and dividend growth.

If anything, these terrorist attacks and the mixed economic data over the past few weeks will keep the Fed’s stimulative monetary policy continuing even longer.  That’s bad news for a bond market already starving for yield.  A 5-year U.S. Treasury bond is yielding 0.70%, 10-year bonds are yielding 1.7%, and the 30-year yield is currently 2.8%.  In all cases, inflation would wipe out any real return from these “riskless” investments. This is also the case with many other types of bond alternatives.

Regardless of what horrible things are going on in the world, the question still facing every investor is this: If you run from stocks, where do you go for income - or even for the potential of a reasonable rate of return? 

We have been saying for years that from an investment perspective, there is no place to hide.  Yet, there are a number of good places to ride out the storms we are traversing.  High quality, dividend-paying stocks are our number one choice.  These kinds of stocks have successfully weathered every storm - both natural and man-made - that the world has thrown at them for over a hundred years and produced rates of return over double that of Treasury bonds.

Friday, January 04, 2013

Dividends: Still The Best All-Season Investment Strategy

Stocks, during the last six years have been, shall we say, . . . unpredictable: surging bull market in 2007, bear market retreat in 2008-2009, then a powerful bull market over the last three years.  As we celebrate the surprisingly good performance of stocks in 2012, we are now being buffeted by the annual year-ahead prognostications of the financial media and Wall Street strategists. Will they be any better at predicting 2013 than they were at predicting 2012?  I don't think so.
Indeed, who correctly foresaw the wild ride we have been on over the last six years, ten years, twenty years etc?  Nobody I know.  That is the reason I became a dividend investor approximately twenty years ago.  It was then that I first learned that dividends had produced nearly 50% of the total return for stocks since the end of World War II.  I also discovered that dividend growth was only about one-third as volatile as earnings or prices, and thus were far more predictable than either.
In summary, dividends offer a cash return, they generate half of the total return of stocks, and dividends are among the most predictable financial data for many companies because dividends are set by the board of directors.
All of us at Donaldson Capital Management are pleased that so many investors have discovered dividend investing.  We think most of them will stick to it, and they will be rewarded for it over the years.  I am troubled by one trend I see, however.  Too many investors appear to be focusing on the current dividend yield alone.  Our research has convinced us that a combination of dividend yield and dividend growth is the best all-season investment strategy.
Recently, I was speaking with my son, Justin about assisting me with some analysis of the volatile stock markets we have been navigating in recent years.  DCM has lots of data analysis equipment, such as Bloomberg and Value-Line, but we do not have what is called a data mining resource.  Justin, is a co-founder of a machine learning company, Big ML.com, in Corvallis, Oregon.  He is a part of group of six tech scientists who are experts in the field of big data, or, as I still like to say, artificial intelligence.  Justin always fusses at me when I use that term.  He says he works in the field of machine learning.
BigML.com has a very accessible and easy to navigate website that can crunch huge quantities of data and generate a "bottom line", so to speak, on about any data set you can throw at it.  A very interesting data mining study they have made is on who survived the Titanic disaster by sex, age, location on the ship.  Some of the finding are intuitive.  One group who disproportionately survived will surprise you.
Justin took me through a few examples of how to assemble the data I wanted to study and how to build a model at BigML.com.  I have been practicing for months and I think I understand what is happening in the data mining process.  Let me say I have heard many lectures from Justin about algorithms.  They are the mathematical T's in the road that the computer "learns" to navigate by looking at all the data from many different angles all at once.  There, let's see how much trouble I get into with him with that explanation.
This week, I did some modeling to determine what fundamental factors have been the best predictors of success for the 500 stocks in the Standard and Poors Index. The fundamental data I used for each of the 500 companies was the annual growth rates of sales, earnings, and dividends over the last five years.  I also included the average annual dividend yield, average annual price to earnings ratio, return on invested capital, and bond ratings.  Below is a picture of the model I built using Justin's website.  I am not going to try to explain everything that you will see.  I will write additional blogs in the future that will help to further explain what is going on in the model.
The model (below), at first glance, looks like an upside down Christmas tree. Indeed, it is called a tree, a decision tree.  Each of the bulbs on the tree are called "nodes" and represent a group of companies in the S&P 500 with similar return and fundamental data characteristics.
Let's get to the good stuff.  That is the heavy black line connecting the first four  balls or bulbs from the blue ball at the top of the model.  You might think of this black wavy line connecting the balls or nodes as the road to success.  The model is not just picking the stocks that have performed the best over the last 5 years.  It is identifying the best performing stocks that can be explained in association with their fundamental data.
On the right side of the model, is a color coded description of the nodes that the black wavy line is passing through, and the numerical levels that the model has identified as a dividing line between the better performing  stocks and the less successful stocks.

Please move below the chart for a simple description of the model's determination of what kinds of stocks have been winners and why.
          

The model starts with 500 companies.  The average annual return over the last five years of this group on an unweighted basis is +3.6%.   The first dividing line, or node, between better performing stocks and the lesser performing stocks is market capitalization, or how big the company is.  The model shows on the right of the chart that the dividing line is roughly at $4.3 billion in market cap.  In general, stocks larger than $4.3 billion in market cap performed better than smaller stocks.

The next node is somewhat illogical that it shows up so early.  The model is saying that stocks with dividend growth greater than a minus 25.65% did better than stocks with dividend growth higher than that level. That would seem to be a duh, but it is essentially kicking out most of the bank stocks, which were forced to cut their dividends dramatically in 2009 and fell sharply in price.  The next node we cross through is 5-year average P/E, and the critical level is 12.80x.   That is a slightly lower 5-year average P/E for our winning stocks than that of the S&P 500 as a whole, but not significantly.

At this point we have eliminated about half of the original 500 stocks, but we don't know much yet about the nature of the winning stocks.  All we really know is that big stocks did better than little stocks.  The difference in P/E is not material, and the dividend growth node is not helping us at all.

That is about to change.  The black, windy road to success just crossed into an node that reveals that stocks with average annual dividend growth of greater than 10.75% were big winners.  This dividing line also cuts the number of remaining stocks to only 98.

In one of the most rambunctious times in the memory of most of us, big stocks that increased their dividends at least 10.75% per annum produced an average annual return of 9.83%, nearly 3 times the rate of return for the average stock in the S&P 500.

But wait, there is more "We'll double your order if you order now."  Forgive me.  I have watched too much Holiday television.  There is more and the defining characteristic of the next node, as shown on the right, is the dividend yield.  I did not show the value of the node because it is at first a bit of a surprise. Stocks that have make it through this node  has a dividend yield of LESS than 2%.  Stocks that successfully passed through all the nodes thus far produced an average annual rate of return of 13.4%.  But wait, that's not more, that's less.  Yes, it is but that is one of the things we have been saying for the last decade: While dividend yield is important, it is not the main driver of success.  Dividend growth is a better predictor of winning stocks if the growth is consistent and persistent. The problem with low yield,  high dividend growth stocks is that high earnings growth is a must to continue the high dividend growth.  Thus these stocks are much more volatile than higher yielding stocks with lower dividend growth.

There you have it.  Over the last 5-6 years, a time as chaotic as any we have seen since the 1930s, the winning recipe in the stock market has been dividend related. We are not surprised by this.  This is the same trend we have observed over the the last 20 years. It is also what the data reveals for the 40 previous years.

Importantly, as we said earlier we discovered many of the dividend principles we still follow today in the early 1990s, a time when dividend investing was out of favor.  We went looking for ways to deal with volatility after the crash of 1987.  It was not until the early 1990s that we began to understand the importance of dividends.  The following paragraph was contained in our quarterly letter mailed to our clients on January 15, 1993.  One might say it sounds like we wrote it last week.  If the truth be know, we probably wrote it or at least shared it with a client or a prospect today.  Well there is another duh.  We are sharing it here.

"We believe that companies with growing dividends will ultimately draw the attention of Wall Street and institutional investors, as well.  This is because a rising stream of income in a slow growth, low interest rate environment will, undoubtedly, become more and more valuable, causing prices to rise on such companies.  Thus, in our judgment, an investment strategy aimed at increasing income is likely to produce capital growth, as well."