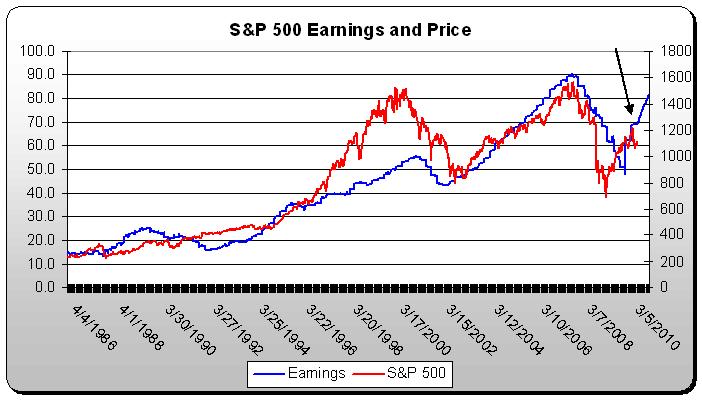
 The chart at the right shows the S&P 500 price (red line, left axis) and earnings (blue line, right axis) on a simple two axis chart. The chart clearly shows, except for the Tech bubble of the late 1990s, that stock prices have tracked earnings very closely. The correlation is over 80%.
Please note that while stock prices were overly exuberant in the late 1990s, that they were too pessimistic in early 2009, falling much faster and farther than earnings did.
The arrow at the far right of the chart points to the current levels of S&P price and earnings. I have extended the earnings line (blue line) to reach current Wall Street earnings estimates for year end 2010. Analysts as of today are estimating that full-year 2010 earnings for the companies in the S&P 500 Index will reach just over $81. With current 12- month trailing earning standing at $69, that would mean that Wall Street expects strong earnings through the end of the year.
Additionally, if the analysts are correct and the historical relationship between prices and earnings reasserts itself by year end, the chart shows that the Index would be around 1400, much higher than its current level of about 1000.
It is clear that if history is to be our guide that both the bullish analysts and the bearish traders cannot both be right. We believe the time may be ripe for at least a partial resolution to the paradox. US companies will begin reporting second quarter earnings within the next ten days. If the analysts are wrong, we will know it very soon. We are inclined to think that their earnings estimates, if anything, will be low. If this were not the case, the financial press would have been full of companies announcing that they were going to miss their earnings targets. That has not happened, either.
Stocks fell sharply during the second quarter as the debt crisis in Greece, Portugal, and Spain became known. We believe the European Union has produced a bailout package for these countries that has a reasonable chance of working. There is some tough medicine in the form of spending cuts and wage adjustments. Nobody likes a pay cut, but we believe that is preferable to a fat check that bounces.
The times we live in are very fluid. The list of possible troubles is long. But there is one thing that many Americans don't seem to be able to put their arms around. One-third of the world's economic growth now comes from the developing nations of China, India, Brazil and the Far East. Not since the early 19th century has so much of the world GDP come from beyond the so-called developed countries.
We realize that we seem to be apologizing for the actions of the market a lot in recent months. We are not doing so out of blind faith. As a result of strong earnings growth over the last two quarters and falling stock prices, stocks have gotten very cheap by historical standards. Stocks are now trading about 13 times 2010 earnings, much lower than the 17 times geometric average P/E of the last 30 years.
The chart at the right shows the S&P 500 price (red line, left axis) and earnings (blue line, right axis) on a simple two axis chart. The chart clearly shows, except for the Tech bubble of the late 1990s, that stock prices have tracked earnings very closely. The correlation is over 80%.
Please note that while stock prices were overly exuberant in the late 1990s, that they were too pessimistic in early 2009, falling much faster and farther than earnings did.
The arrow at the far right of the chart points to the current levels of S&P price and earnings. I have extended the earnings line (blue line) to reach current Wall Street earnings estimates for year end 2010. Analysts as of today are estimating that full-year 2010 earnings for the companies in the S&P 500 Index will reach just over $81. With current 12- month trailing earning standing at $69, that would mean that Wall Street expects strong earnings through the end of the year.
Additionally, if the analysts are correct and the historical relationship between prices and earnings reasserts itself by year end, the chart shows that the Index would be around 1400, much higher than its current level of about 1000.
It is clear that if history is to be our guide that both the bullish analysts and the bearish traders cannot both be right. We believe the time may be ripe for at least a partial resolution to the paradox. US companies will begin reporting second quarter earnings within the next ten days. If the analysts are wrong, we will know it very soon. We are inclined to think that their earnings estimates, if anything, will be low. If this were not the case, the financial press would have been full of companies announcing that they were going to miss their earnings targets. That has not happened, either.
Stocks fell sharply during the second quarter as the debt crisis in Greece, Portugal, and Spain became known. We believe the European Union has produced a bailout package for these countries that has a reasonable chance of working. There is some tough medicine in the form of spending cuts and wage adjustments. Nobody likes a pay cut, but we believe that is preferable to a fat check that bounces.
The times we live in are very fluid. The list of possible troubles is long. But there is one thing that many Americans don't seem to be able to put their arms around. One-third of the world's economic growth now comes from the developing nations of China, India, Brazil and the Far East. Not since the early 19th century has so much of the world GDP come from beyond the so-called developed countries.
We realize that we seem to be apologizing for the actions of the market a lot in recent months. We are not doing so out of blind faith. As a result of strong earnings growth over the last two quarters and falling stock prices, stocks have gotten very cheap by historical standards. Stocks are now trading about 13 times 2010 earnings, much lower than the 17 times geometric average P/E of the last 30 years.

Wednesday, June 30, 2010
Paradox Found, May Be Soon Resolved
In recent weeks, the stock market seems to have lost it moorings and found itself thrashing about in heavy seas. US stocks appear to be caught in gale-force fears of all sorts of impending disasters from runaway inflation to a double dip in the economy.
But if the market's fears are justified, they should be showing up in the economic data. They are not. Indeed, the current level of core inflation on a year over year basis stands at 0.9%, the lowest annual figure since 1958. If anything this would tell us we should be worrying more about deflation than inflation. We can assure you that deflation is a greater worry than inflation to Ben Bernanke and his friends at the Federal Reserve. Furthermore, the economy is growing at just under 3%. That is slower than what we would expect coming out of the recent recession, but it is still close to the 50-year average annual GDP growth and shows good signs of continued modest growth.
If the recent sell off in stocks is justified, and not just the fear-induced selling by hedge funds and day traders, then we should expect to see analyst's earnings estimates collapsing. We don't see that either. Indeed, analyst earnings estimates for the S&P 500 Index continue to rise almost every week for year-end 2010.
If analysts are raising earnings estimates while stock prices are falling, it would mean that the market does not believe the earnings are sustainable and may fall apart in 2011. But the analysts are not just hiking estimates for the next six months, they are also hiking earnings estimates for 2011. As of today the consensus estimate for the S&P 500 is that earnings will grow by nearly 17% in 2011. If the analysts are to be believed, then the current selling price of the S&P 500 is way under priced.
Click the chart to enlarge. The chart at the right shows the S&P 500 price (red line, left axis) and earnings (blue line, right axis) on a simple two axis chart. The chart clearly shows, except for the Tech bubble of the late 1990s, that stock prices have tracked earnings very closely. The correlation is over 80%.
Please note that while stock prices were overly exuberant in the late 1990s, that they were too pessimistic in early 2009, falling much faster and farther than earnings did.
The arrow at the far right of the chart points to the current levels of S&P price and earnings. I have extended the earnings line (blue line) to reach current Wall Street earnings estimates for year end 2010. Analysts as of today are estimating that full-year 2010 earnings for the companies in the S&P 500 Index will reach just over $81. With current 12- month trailing earning standing at $69, that would mean that Wall Street expects strong earnings through the end of the year.
Additionally, if the analysts are correct and the historical relationship between prices and earnings reasserts itself by year end, the chart shows that the Index would be around 1400, much higher than its current level of about 1000.
It is clear that if history is to be our guide that both the bullish analysts and the bearish traders cannot both be right. We believe the time may be ripe for at least a partial resolution to the paradox. US companies will begin reporting second quarter earnings within the next ten days. If the analysts are wrong, we will know it very soon. We are inclined to think that their earnings estimates, if anything, will be low. If this were not the case, the financial press would have been full of companies announcing that they were going to miss their earnings targets. That has not happened, either.
Stocks fell sharply during the second quarter as the debt crisis in Greece, Portugal, and Spain became known. We believe the European Union has produced a bailout package for these countries that has a reasonable chance of working. There is some tough medicine in the form of spending cuts and wage adjustments. Nobody likes a pay cut, but we believe that is preferable to a fat check that bounces.
The times we live in are very fluid. The list of possible troubles is long. But there is one thing that many Americans don't seem to be able to put their arms around. One-third of the world's economic growth now comes from the developing nations of China, India, Brazil and the Far East. Not since the early 19th century has so much of the world GDP come from beyond the so-called developed countries.
We realize that we seem to be apologizing for the actions of the market a lot in recent months. We are not doing so out of blind faith. As a result of strong earnings growth over the last two quarters and falling stock prices, stocks have gotten very cheap by historical standards. Stocks are now trading about 13 times 2010 earnings, much lower than the 17 times geometric average P/E of the last 30 years.
The chart at the right shows the S&P 500 price (red line, left axis) and earnings (blue line, right axis) on a simple two axis chart. The chart clearly shows, except for the Tech bubble of the late 1990s, that stock prices have tracked earnings very closely. The correlation is over 80%.
Please note that while stock prices were overly exuberant in the late 1990s, that they were too pessimistic in early 2009, falling much faster and farther than earnings did.
The arrow at the far right of the chart points to the current levels of S&P price and earnings. I have extended the earnings line (blue line) to reach current Wall Street earnings estimates for year end 2010. Analysts as of today are estimating that full-year 2010 earnings for the companies in the S&P 500 Index will reach just over $81. With current 12- month trailing earning standing at $69, that would mean that Wall Street expects strong earnings through the end of the year.
Additionally, if the analysts are correct and the historical relationship between prices and earnings reasserts itself by year end, the chart shows that the Index would be around 1400, much higher than its current level of about 1000.
It is clear that if history is to be our guide that both the bullish analysts and the bearish traders cannot both be right. We believe the time may be ripe for at least a partial resolution to the paradox. US companies will begin reporting second quarter earnings within the next ten days. If the analysts are wrong, we will know it very soon. We are inclined to think that their earnings estimates, if anything, will be low. If this were not the case, the financial press would have been full of companies announcing that they were going to miss their earnings targets. That has not happened, either.
Stocks fell sharply during the second quarter as the debt crisis in Greece, Portugal, and Spain became known. We believe the European Union has produced a bailout package for these countries that has a reasonable chance of working. There is some tough medicine in the form of spending cuts and wage adjustments. Nobody likes a pay cut, but we believe that is preferable to a fat check that bounces.
The times we live in are very fluid. The list of possible troubles is long. But there is one thing that many Americans don't seem to be able to put their arms around. One-third of the world's economic growth now comes from the developing nations of China, India, Brazil and the Far East. Not since the early 19th century has so much of the world GDP come from beyond the so-called developed countries.
We realize that we seem to be apologizing for the actions of the market a lot in recent months. We are not doing so out of blind faith. As a result of strong earnings growth over the last two quarters and falling stock prices, stocks have gotten very cheap by historical standards. Stocks are now trading about 13 times 2010 earnings, much lower than the 17 times geometric average P/E of the last 30 years.