
1. After-tax Profits

The price of the S&P 500 index (blue line/right axis) plotted against after tax profits for the entire U.S. market (red line/left axis), which is measured in trillions of dollars.
Of all the indicators we watch, this one might be the most compelling argument for the strength of U.S. corporations. After-tax profits reached a high around $1.4 trillion in late 2006 before their sharp decline during the Great Recession of 2008-09. Today’s levels are well above where they were pre-2008 and show no signs of slowing down. Companies are operating with incredible efficiency. Many of the companies we follow can produce as much or more than they did prior to the Great Recession with significantly fewer employees. While this hasn’t been good news for employment (more on that in a minute), it is very positive for corporate earnings.
About 75% of the total after-tax profits come from the companies that comprise the S&P 500 Index. When S&P 500 prices diverge either up or down from after-tax profits, it has a significant message as to the overall value of the market. It is clear that there is no divergence at present. Profits and prices have moved in line since 2009. In our mind, this is further proof that the market is about fairly valued. Despite the strong performance of stocks in 2013, prices have not run above the underlying company earnings.
2. Employment Is Improving

The government’s weekly report of unemployment insurance claims (blue line/right axis) measured in thousands compared to the unemployment rate percentage (red line/left axis).
While lean head counts may be good for corporate profitability, it’s been a major headwind for employment. Prior to 2008, the unemployment rate was hovering around 5%. Since then, the U.S. economy has had a very difficult time adding new jobs. After peaking in 2010, the unemployment rate has steadily fallen, but has not come near where it was before the Great Recession. Even more concerning was the duration of unemployment. The longer a person goes without finding a job, the less qualified they become as their skills diminish. Long-term unemployment is a problem because it destroys aggregate productivity and causes the long-term unemployed to give up their search for work.
While employment continues to be a headwind to economic growth, the picture is improving. The unemployment rate has fallen from over 8% in 2012 to below 6.5% today. There are many who claim that discouraged people leaving the workforce have artificially distorted the unemployment numbers. Our research also indicates that those who have gone to the sidelines have had a positive impact on the unemployment numbers. However, the other employment data we watch supports the falling unemployment rate. As the chart shows, initial unemployment claims have fallen in a virtually linear fashion since 2010. Furthermore, the underlying employment numbers have improved greatly – even over the past 12 months. From April 2013 to April 2014, the percentage of the long-term unemployed has fallen from 54.3% to 50.9%, while the percentage of unemployed less than 5 weeks has increased from 21.4% to 25%.
As a whole, the employment data indicates that more Americans are finding and keeping their jobs. Those who are unemployed have spent less time without a job and it appears to be taking fewer weeks to find new work. Employment is improving, which is a very good sign for the economy.
3. Inflation Is (Almost) Here
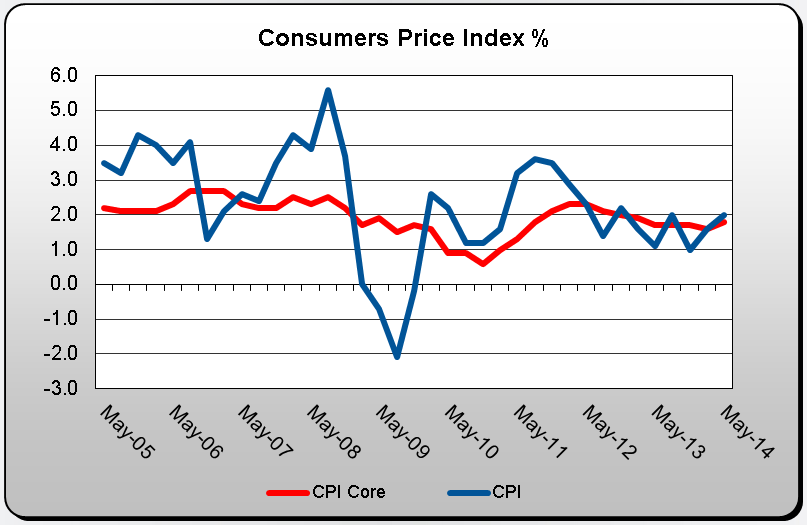
The Bureau of Labor Statistic’s monthly calculation of Core CPI (red line) and CPI (blue line). CPI measures the change in prices of a basket of around 80,000 goods and services. Core CPI excludes food and energy prices (which tend to be more volatile) from the measurement.
Since the Federal Reserve began their Quantitative Easing (QE) program, there has been a great deal of concern that inflation would ramp up. The exact opposite has been the case. As the chart shows, core inflation (red line) has fallen from 2.5% in mid-2012 down to levels near 1.5% in 2013. Inflationary concerns shifted from too high to too low. Recent fears about deflation in the U.S. have caused concerns among investors.
Deflation is bad for the economy because it makes sitting on cash profitable, which discourages both spending and borrowing. When the price of goods or services will be less tomorrow than they are today, consumers benefit by delaying consumption. This delayed consumption leads to the dreaded “deflationary trap” as falling consumption lowers demand and keeps prices falling, which leads to still lower consumption.
Since the end of 2013, deflationary fears have been muted by the modest uptick in inflation. A healthy level of inflation is helpful for corporate profits because it allows for increased pricing power. While the economy is still a ways away from the Fed’s target core inflation rate of 2.5%, things are starting to move in the right direction. If the trend continues, it will have a positive impact on both company earnings and investor confidence.
What Does It Mean for the Stock Market?
The improving state of the economy coupled with continued low interest rates, decreasing uncertainty surrounding the Fed’s tapering of QE, and reduced fears about deflation has been steadily building the case for stocks to continue their upward climb in 2014. The pause in prices so far has been good for the long-term health of the bull market. We expect economic data to continue to be muddied until mid-to-late 2014, but we believe the economy is getting stronger. Once investors can see things more clearly, we expect companies, especially those with visible earnings growth, to be rewarded.